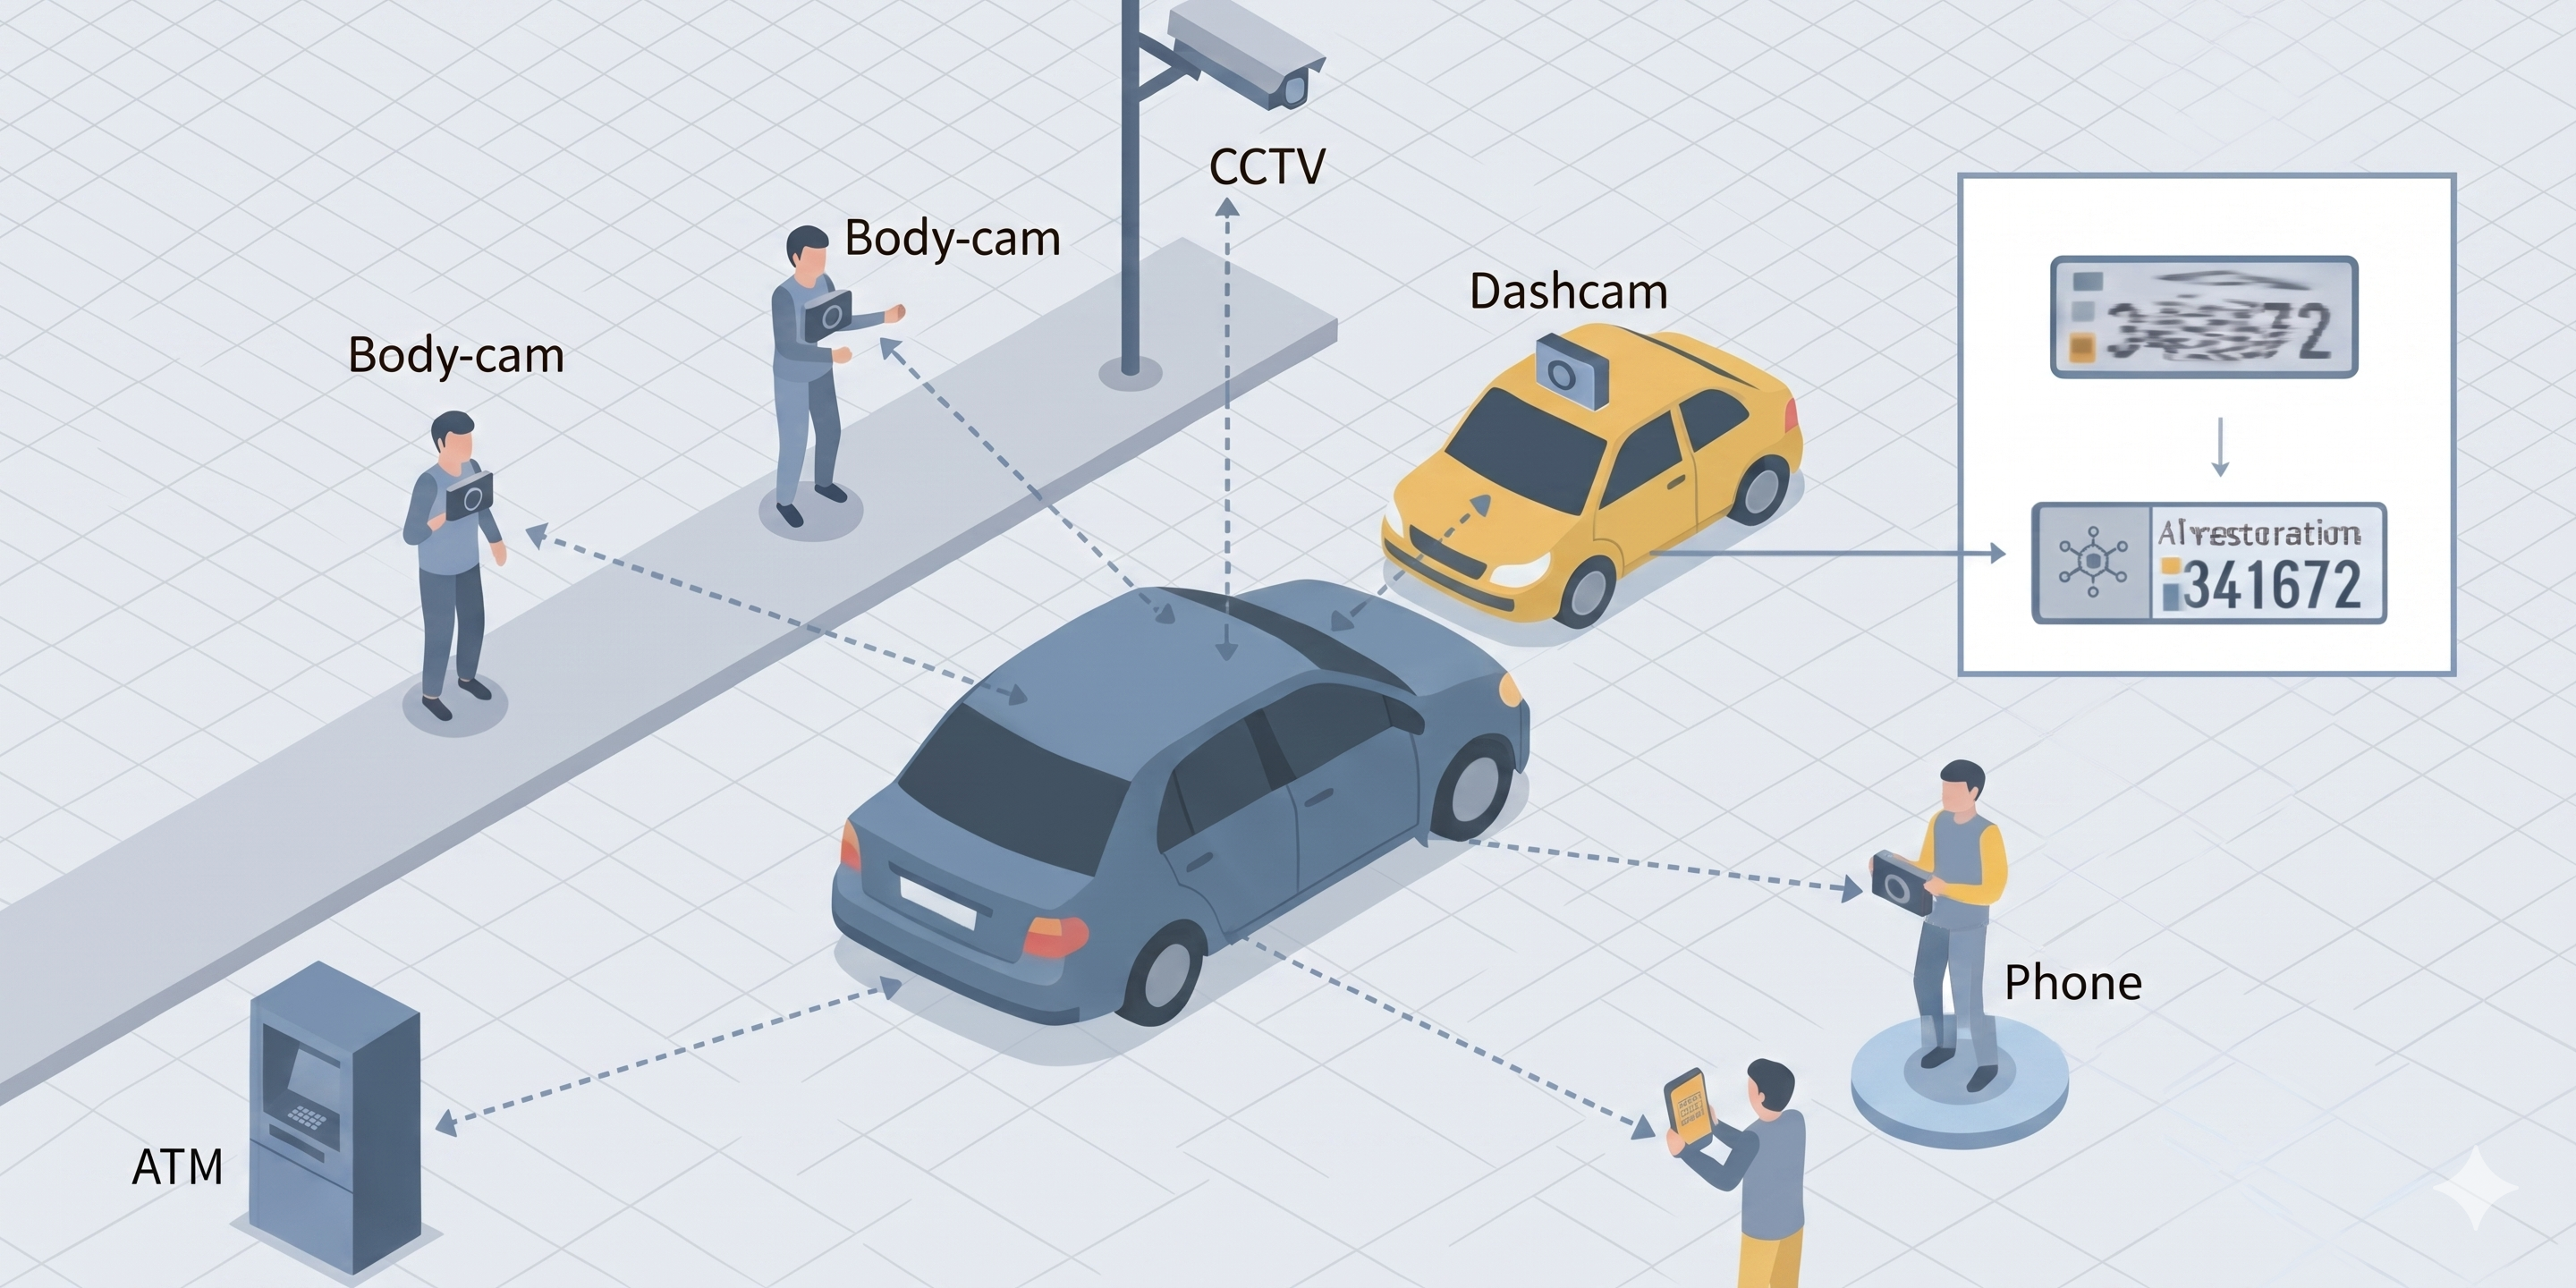
Urban environments are saturated with imaging sensors deployed for purposes unrelated to vehicle identification, including automated teller machine cameras, body-worn devices, dashboard cameras, pole-mounted CCTV, and smartphones. We term the use of such non-purpose-built sensors for secondary inference opportunistic sensing; its central open question is where in the space of uncontrolled capture conditions AI-enabled restoration remains reliable. This paper introduces recoverability maps, a task-agnostic methodology for quantifying that boundary, and applies it to oblique-view license plate recognition (LPR) as a concrete showcase. The methodology combines a full-grid synthetic sweep of the degradation parameter space with two summary measures: a boundary area-under-curve that quantifies the fraction of parameter space where inference succeeds, and a reliability score $F$ that measures the frequency and depth of interior failures. For the LPR showcase the parameter space is the oblique-angle grid $[0^\circ, 89^\circ]^2$ sampled by Scrambled Sobol sequences, the degradation combines homographic projection with realistic camera artifacts, and the downstream utility is plate-level optical character recognition accuracy. Five restoration architectures are trained and evaluated on the shared grid: U-Net, an angle-conditioned U-Net, Restormer, Pix2Pix, and an SR3 diffusion model. Approximately $93.4\%$ of the angle grid is recoverable by the best evaluated model; recovery degrades sharply beyond roughly $80^\circ$ in both axes simultaneously, and lateral rotations are consistently harder to reconstruct than elevational ones. Discriminative architectures outperform generative models on coverage, training efficiency, and interior consistency. All five models cluster within a narrow AUC band of $0.89$–$0.92$ and share the same $\alpha/\beta$ asymmetry, indicating that the shape of the recoverable region is determined primarily by sensing geometry rather than by the choice of architecture.
Urban infrastructure routinely accumulates data from sensors installed for one purpose that can be reused for another at near-zero marginal cost. Smartphone accelerometers, originally built for screen-orientation and step counting, have been used to map road-surface defects from ordinary driving (Eriksson et al., 2008). Smart-meter electricity readings, installed for billing, carry enough detail to infer appliance-level activity patterns. Ambient microphones on mobile devices, deployed for voice assistants, can estimate traffic density and crowd activity (Lane et al., 2010). Parking-sensor magnetometers and pedestrian-counter beam-breakers similarly admit secondary interpretations beyond their design specification. This pattern, which Campbell et al. (2008) and Ganti et al. (2011) termed opportunistic sensing, has the same underlying structure in every case: a sensor deployed for purpose A produces a signal rich enough to support a secondary inference B, provided B's signal survives the sensor's original acquisition constraints. The practical question is rarely whether opportunistic reuse is possible in principle, but where in the space of uncontrolled acquisition conditions the secondary inference remains reliable.
Imaging sensors are the most information-dense instance of this pattern. Smart cities host over one billion surveillance cameras (Kitchin, 2014), together with an order of magnitude more mobile cameras on vehicles and handheld devices, almost none calibrated for any specific downstream inference. When a vehicle of interest passes within range of one of these cameras, the captured image can be the only available record. Because the sensor was positioned for an unrelated task, however, the plate typically appears at oblique angles, foreshortened, blurred, and compressed, conditions that cause standard license plate recognition (LPR) pipelines to fail. Modern deep-learning image restoration plausibly recovers such plates, but the angular extent of this recovery has not been mapped. This paper asks: given a camera that cannot be repositioned, at what viewing angles does enough signal survive for automatic LPR to succeed?
Public benchmarks for recognition tasks are typically task-purposed: their captures are curated under controlled or semi-controlled conditions that foreground readability and downstream success. This curation is appropriate when the task is the primary goal of the sensor, but it leaves an inferential gap when the same sensor is used opportunistically for a secondary task. The conditions under which opportunistic sensing operates, namely the extreme corners of the acquisition-parameter space, are systematically underrepresented in benchmarks that were never designed to cover them. A synthetic benchmark that samples the full parameter grid, including the extreme corners, is therefore a natural tool for characterising the boundary of what opportunistic sensing can recover; its role is not to replace real-world evaluation but to map a regime that real benchmarks do not reach.
Existing LPR research assumes near-frontal capture, typically $|\alpha|, |\beta| \leq 30^\circ$, and degrades rapidly beyond this range (Shashirangana et al., 2021; Anagnostopoulos et al., 2008). In opportunistic captures, by contrast, the plate routinely appears at $\alpha, \beta > 60^\circ$. The angular extent within which modern deep-learning image restoration can still recover a readable plate has not been mapped.
Contributions. The primary contribution of this paper is methodological: we introduce recoverability maps, a task-agnostic framework for quantifying where in a parameterised degradation space an opportunistic sensing task remains reliable, together with two summary measures (a boundary area-under-curve and a reliability score $F$) that are adapted from classical operating-characteristic and envelope analyses (Martin et al., 1997) to the two-dimensional setting. The framework is demonstrated on oblique-view LPR, yielding a systematic empirical comparison of five deep-learning restoration architectures (U-Net, angle-conditioned U-Net, Restormer, Pix2Pix, SR3 diffusion) on a shared $[0^\circ, 89^\circ]^2$ grid. Under the conditions of the LPR benchmark, approximately $93.4\%$ of the angle grid is recoverable by the best evaluated model, breakdown occurs beyond roughly $80^\circ$ in both axes simultaneously, lateral rotations are consistently harder than elevational ones, and PSNR tracks OCR accuracy closely enough ($R^2 = 0.99$) to serve as a training-time surrogate. The instances of the framework beyond LPR are sketched in Section 6.
Opportunistic sensing, in which sensors deployed for one purpose are secondarily exploited for another, has been systematically studied in mobile and pervasive computing. Burke et al. (2006) introduced participatory sensing as a framework for community-scale data collection using everyday mobile devices; Campbell et al. (2008) and Ganti et al. (2011) extended this to opportunistic inference from always-on smartphone sensors. Lane et al. (2010) demonstrated that commodity accelerometers, microphones, and cameras embedded in mobile phones can serve as general-purpose environmental monitors when paired with appropriate inference algorithms. In urban systems research, related concepts include volunteer geographic information (Goodchild, 2007) and the broader data-driven city management paradigm (Batty, 2013; Kitchin, 2014).
The diversity of camera platforms in urban environments substantially widens the scope of opportunistic sensing beyond fixed infrastructure, following the broader pattern established by Eriksson et al. (2008) for vehicle-mounted sensing without dedicated sensing missions.
Urban computing (Zheng et al., 2014) and smart city frameworks (Townsend, 2013) emphasise algorithmic repurposing of existing infrastructure to avoid capital expenditure. Two adjacent literatures inform the present study. First, urban camera geometry: the classical calibration framework of Zhang (2000) provides the mathematical foundation for estimating the oblique pose of arbitrary fixed cameras from minimal scene content, a prerequisite for relating any empirical recoverability map to a specific urban sensor in the field. Second, privacy in secondary-use imagery: Frome et al. (2009) documented large-scale face and license-plate blurring in Google Street View, establishing that extracting identity information from opportunistic captures carries well-understood ethical constraints which any deployment of the methods studied here must respect. Recent deep learning advances make such repurposing technically viable: where classical computer vision required controlled illumination, known geometry, and near-frontal capture, modern restoration pipelines can recover structured information from imagery that would previously have been discarded. The present work contributes a first quantitative angular boundary for when this AI-enabled repurposing succeeds for LPR under a controlled synthetic pipeline.
LPR is a mature technology in controlled conditions. Comprehensive surveys (Shashirangana et al., 2021; Anagnostopoulos et al., 2008) document pipelines covering plate detection, character segmentation, and OCR, with commercial systems achieving near-perfect accuracy when plates are captured within $\pm 30^\circ$ of the optical axis. Oblique-view LPR pipelines exist, but they follow a detection-then-deskew paradigm that assumes the plate is already roughly readable before processing: homography estimation corrects for known moderate angles but breaks down once the plate is severely foreshortened.
Laroca et al. (2021) constructed a large-scale benchmark for end-to-end automatic LPR and demonstrated that recognition accuracy degrades substantially at oblique capture angles even for state-of-the-art YOLO-based detectors, confirming the practical gap addressed here. Their detection-first pipeline implicitly assumes digit contrast and horizontal separation remain sufficient for segmentation, an assumption that fails once azimuthal rotation exceeds approximately $45^\circ$. Laroca et al. (2022) later expanded this line with RodoSol-ALPR, explicitly evaluating cross-dataset generalisation and showing that LPR performance can drop sharply when the evaluation distribution differs from training. Silva and Jung (2018) proposed WPOD-NET to rectify oblique plates via per-instance planar warping before recognition, a detect-then-deskew approach that works well up to moderate angles but still requires the plate to be roughly readable. Xu et al. (2021) built an explicit perspective-rectification module into the LPR pipeline. A parallel line of work treats oblique LPR as a super-resolution problem: Zou et al. (2019) target extremely low-resolution plates, and Hamdi et al. (2021) combine image enhancement with super-resolution to improve downstream OCR. The present work takes a different angle from these restoration-oriented studies: rather than proposing another restoration architecture, we map where in the angle space restoration remains viable at all, treating recoverability as a measurable property of the sensing geometry.
Evaluation of recognition under degradation has a long history in related domains. PSNR and SSIM (Wang et al., 2004) are the standard image-quality proxies, but their correlation with downstream task performance is contested: for OCR and face recognition, PSNR is a more reliable predictor than SSIM (Chen et al., 2024). This relationship has not been established for LPR under oblique-angle distortion. Prior recoverability analyses in audio and face recognition use threshold curves and operating-characteristic measures over a degradation parameter, but no such framework has been applied to the two-dimensional $(\alpha, \beta)$ space of camera viewing angles; the present work provides such a characterisation.
The U-Net architecture (Ronneberger et al., 2015), with its skip connections between encoder and decoder, remains a strong baseline for paired image-to-image tasks. The foundational U-Net architecture uses skip connections to preserve spatial detail through successive downsampling and upsampling stages. Oktay et al. (2018) extended it with soft attention gates (Attention U-Net) that selectively emphasise encoder features relevant to the decoder prediction; a natural fit for localised digit regions on a plate. Transformer-based alternatives such as Restormer (Zamir et al., 2022) and Uformer (Wang et al., 2022) extend global context modelling to restoration, achieving state-of-the-art results on denoising and deblurring benchmarks.
On the generative side, Goodfellow et al. (2014) introduced the generative adversarial network (GAN) framework; Pix2Pix (Isola et al., 2017) adapted this to paired image translation via a patch discriminator. ESRGAN (Wang et al., 2018) demonstrated that perceptual and adversarial losses recover fine texture detail in super-resolution, at the cost of potential hallucination artefacts analogous to those we observe in Diffusion-SR3. Saharia et al. (2022) proposed SR3, conditioning a denoising diffusion probabilistic model on a low-quality input for iterative refinement; we adapt this architecture directly for oblique-plate restoration. None of these works has been benchmarked on the systematic oblique-angle regime relevant to urban camera repurposing.
Monte Carlo methods for sampling multi-dimensional parameter spaces suffer from clustering and gaps at moderate sample sizes. Sobol sequences, a class of quasi-Monte Carlo methods (Burhenne et al., 2011; Joe & Kuo, 2008), provide provably better coverage of the unit hypercube than pseudo-random sampling: the discrepancy of an $N$-point Sobol set grows as $O((\log N)^d / N)$ compared to $O(N^{-1/2})$ for random sampling in dimension $d$. Applying Sobol sequences to the angle space ensures that the training dataset covers extreme and moderate angles uniformly, which is essential for learning a restoration model that generalizes across the full deployment range of a fixed urban sensor.
Notation. The following symbols are used consistently throughout the paper:
Consider a fixed camera at position $\mathbf{p}$ in an urban environment. A vehicle passes within the camera field of view, and its license plate undergoes a rotation described by two angles: $\alpha \in [-90^\circ, 90^\circ]$ (azimuthal, lateral tilt relative to the camera optical axis) and $\beta \in [-90^\circ, 90^\circ]$ (elevational, vertical tilt). The 3D rotation of the plate normal vector is modelled as successive rotations $\mathbf{R}(\alpha, \beta)$ applied in homogeneous coordinates, followed by a perspective projection $\Pi$ onto the image plane:
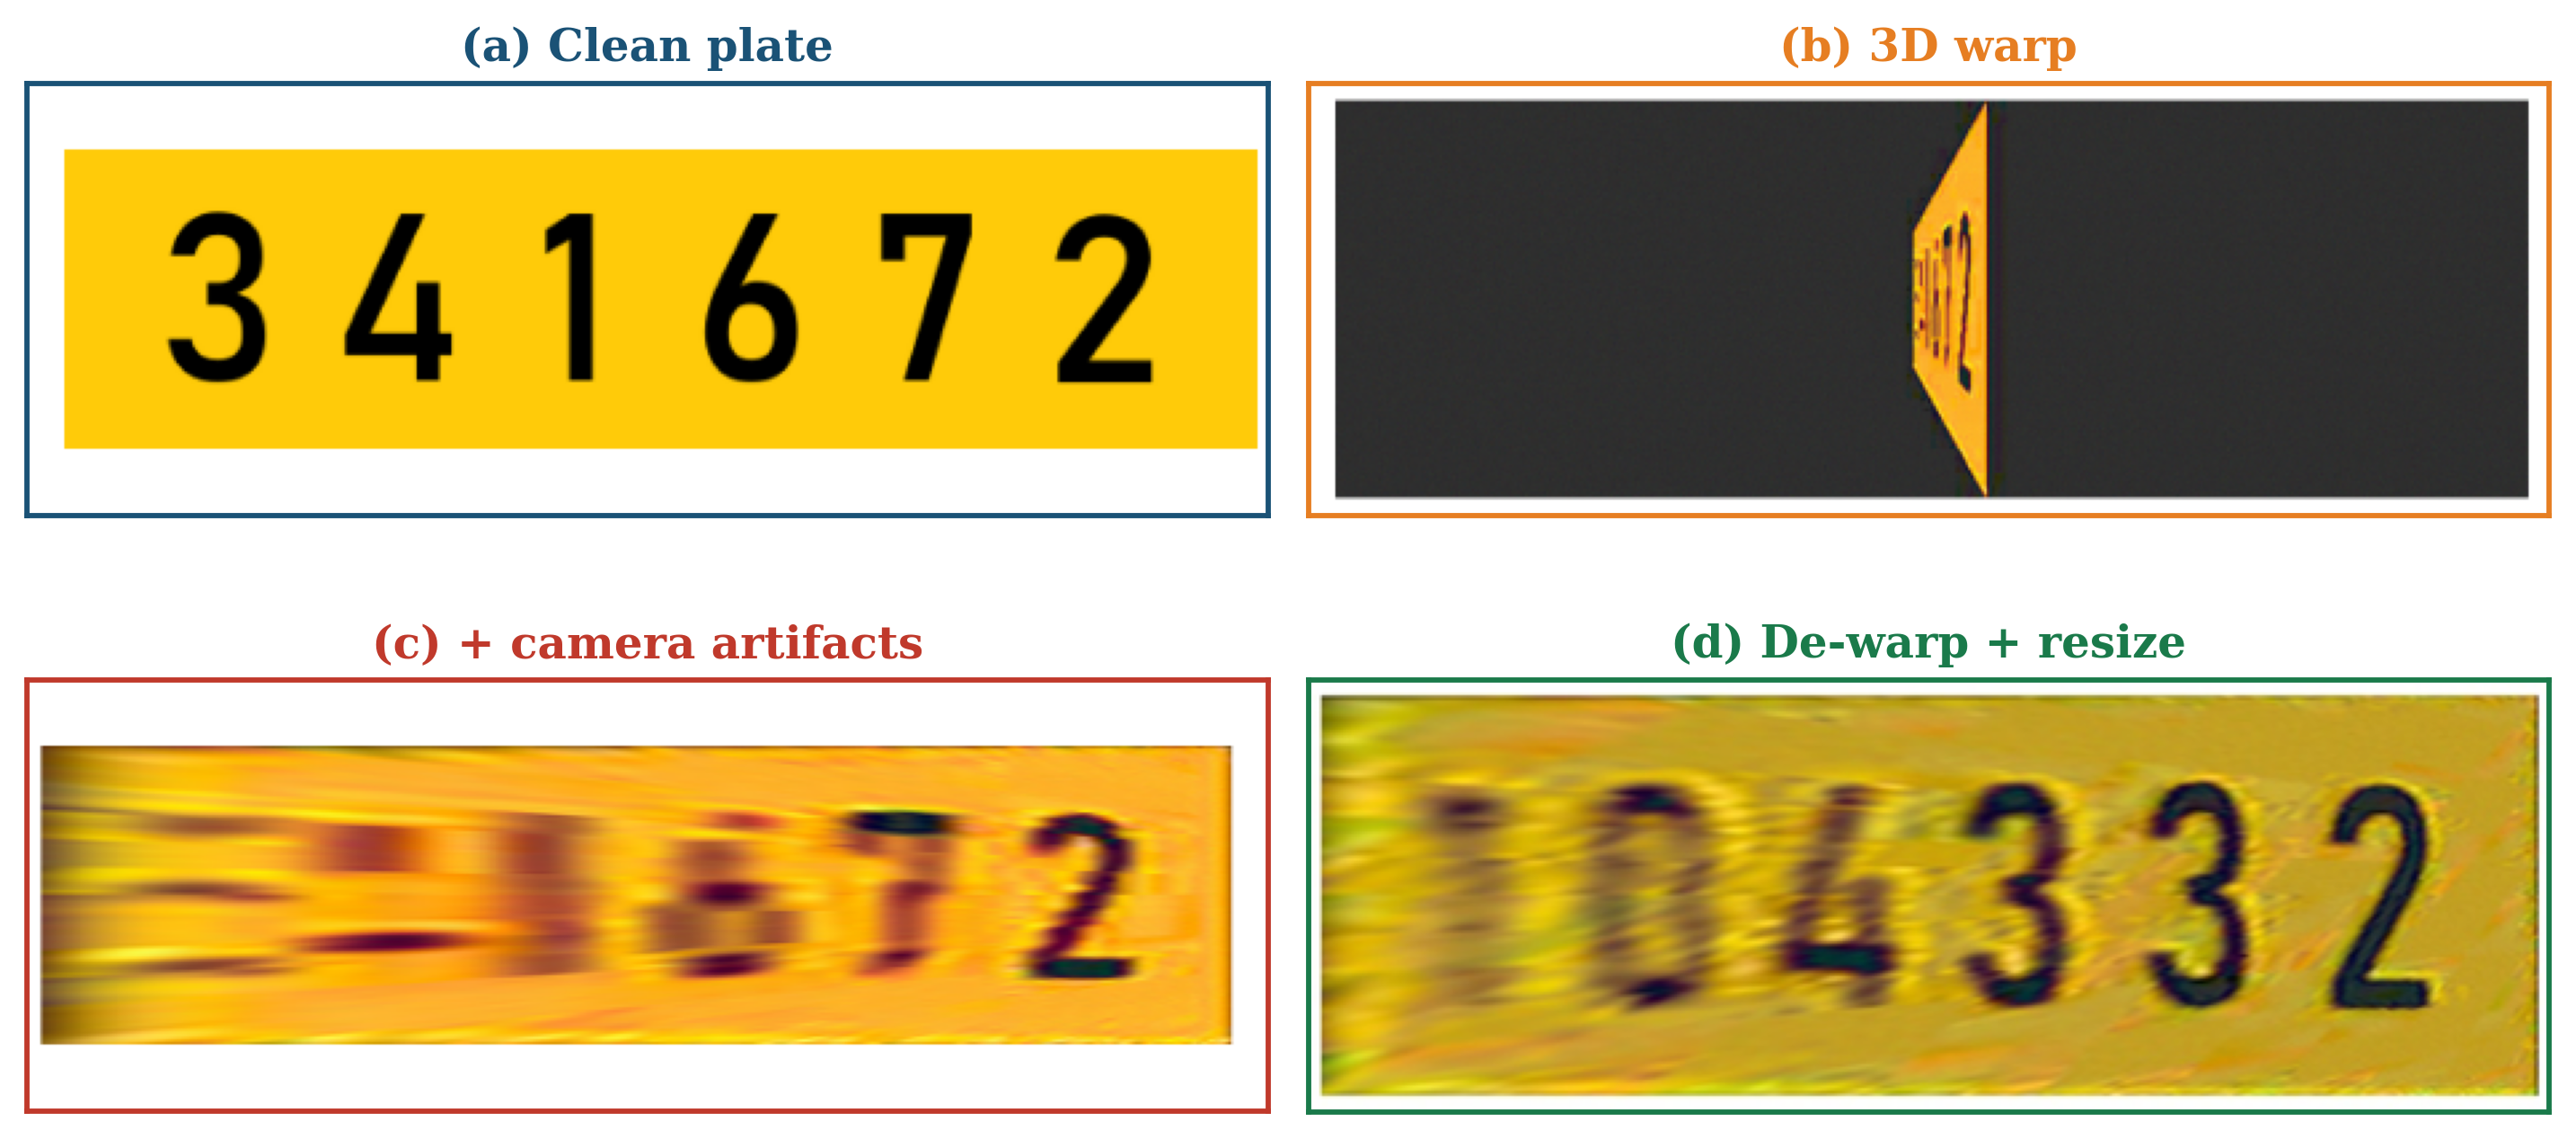
where $x_0$ is the clean plate image, $\mathbf{R}(\alpha,\beta)\,x_0$ applies the planar rotation in homogeneous coordinates, $\Pi$ is the perspective projection, and the four degradation stages are applied in order: $D_{\text{edge}}$ performs alpha-mask edge blending with a signed-distance field, $D_{\text{jitter}}$ applies brightness/contrast/saturation jitter, $D_{\text{blur}}$ applies isotropic Gaussian blur with $\sigma \in [0.5, 1.5]$, and $D_{\text{JPEG}}$ compresses the image at quality $q \in [55, 85]$. The composition yields the observed distorted image $x_d$. Following the construction described in Section 4.1, $x_d$ is subsequently de-warped by the inverse homography $R(\alpha,\beta)^{-1}$ and resized to $256\times 64$ before being passed to the restoration network; this re-aligned input is what each $f_\theta$ learns to correct. Thus the angular boundary reported in this paper is the boundary after inverse-homography compensation and reflects what information remains after resampling, not the raw oblique capture. The goal is to learn a restoration function $\hat{x}_0 = f_\theta(x_d)$ such that an OCR engine applied to $\hat{x}_0$ correctly reads the plate number.
Although the remainder of this paper specialises to LPR, the recoverability formalism introduced below is task-agnostic: given any parameterised degradation space $\mathcal{P}$ and any binary utility function $u : \mathcal{P} \to \{0, 1\}$ indicating successful inference, the boundary-AUC and reliability score $F$ defined in Eqs. 5 and 7 carry over verbatim. In this paper $\mathcal{P} = [0^\circ, 89^\circ]^2$ is the oblique-angle grid and $u$ is thresholded plate-level OCR accuracy; other opportunistic-sensing tasks would instantiate $\mathcal{P}$ and $u$ differently but use the same machinery.
Let $\text{OCR}_{\text{plate}}(\alpha, \beta) \in [0, 1]$ denote the mean plate-level recognition accuracy (fraction of digits correctly identified) over a set of test images at angle pair $(\alpha, \beta)$. We define the binary recoverability indicator at threshold $T$:
We set $T = 0.9$, requiring at least 9 out of 10 plates at each angle pair to be fully recognized. The recoverability boundary $B_T$ is the outer envelope of the region where $r_T = 1$. Formally, define (using the convention $\max\varnothing=-1$ so a fully unrecoverable slice is distinguishable from a boundary at $\beta=0$):
The boundary is $B_T = C_1 \cup C_2$ where $C_1 = \{(\alpha, \beta_{\max}(\alpha))\}$ and $C_2 = \{(\alpha_{\max}(\beta), \beta)\}$ for $\alpha, \beta \in [0, 89]$. The boundary-AUC normalises the enclosed area by the full grid:
Boundary-AUC measures the area enclosed by the outer envelope of the recoverable region and therefore quantifies its coverage; by construction it does not penalise non-convex structure, for instance holes of failure inside the envelope, which can inflate AUC relative to the actually recoverable area. To capture the consistency of recoverability inside $B_T$, we measure how deeply failures penetrate the recoverable region, a quantity conceptually related to erosion-style measures in mathematical morphology (Serra, 1982). For each failed angle pair $(\alpha_h, \beta_h)$ inside $B_T$, compute its minimum Euclidean distance to the boundary:
The reliability score $F$ is the root-mean-square of these distances, normalised by the enclosed area $E$:
$F = 0$ denotes no interior failures; larger values of $F$ indicate more frequent or deeper failures. Taken together, boundary-AUC quantifies the extent of the viewing-angle space over which recovery succeeds, while $F$ measures the frequency and depth of failure pockets within the nominally recoverable region. A model with high AUC and low $F$ covers a wide area uniformly; a model with high AUC but also high $F$ covers a wide area but behaves inconsistently; a model with low AUC and low $F$ covers less but fails predictably. OCR is used as the ground truth for recoverability because it measures the downstream utility of the restored plate. PSNR and SSIM are evaluated subsequently as candidate training-time surrogates for OCR (Section 5.5).
We generate clean license plate images by rendering random 6-digit numeric strings on a yellow background using a single standard vehicle licence-plate font and dimensions, downscaled to $256 \times 64$ pixels. Each plate is then distorted through a five-stage pipeline:
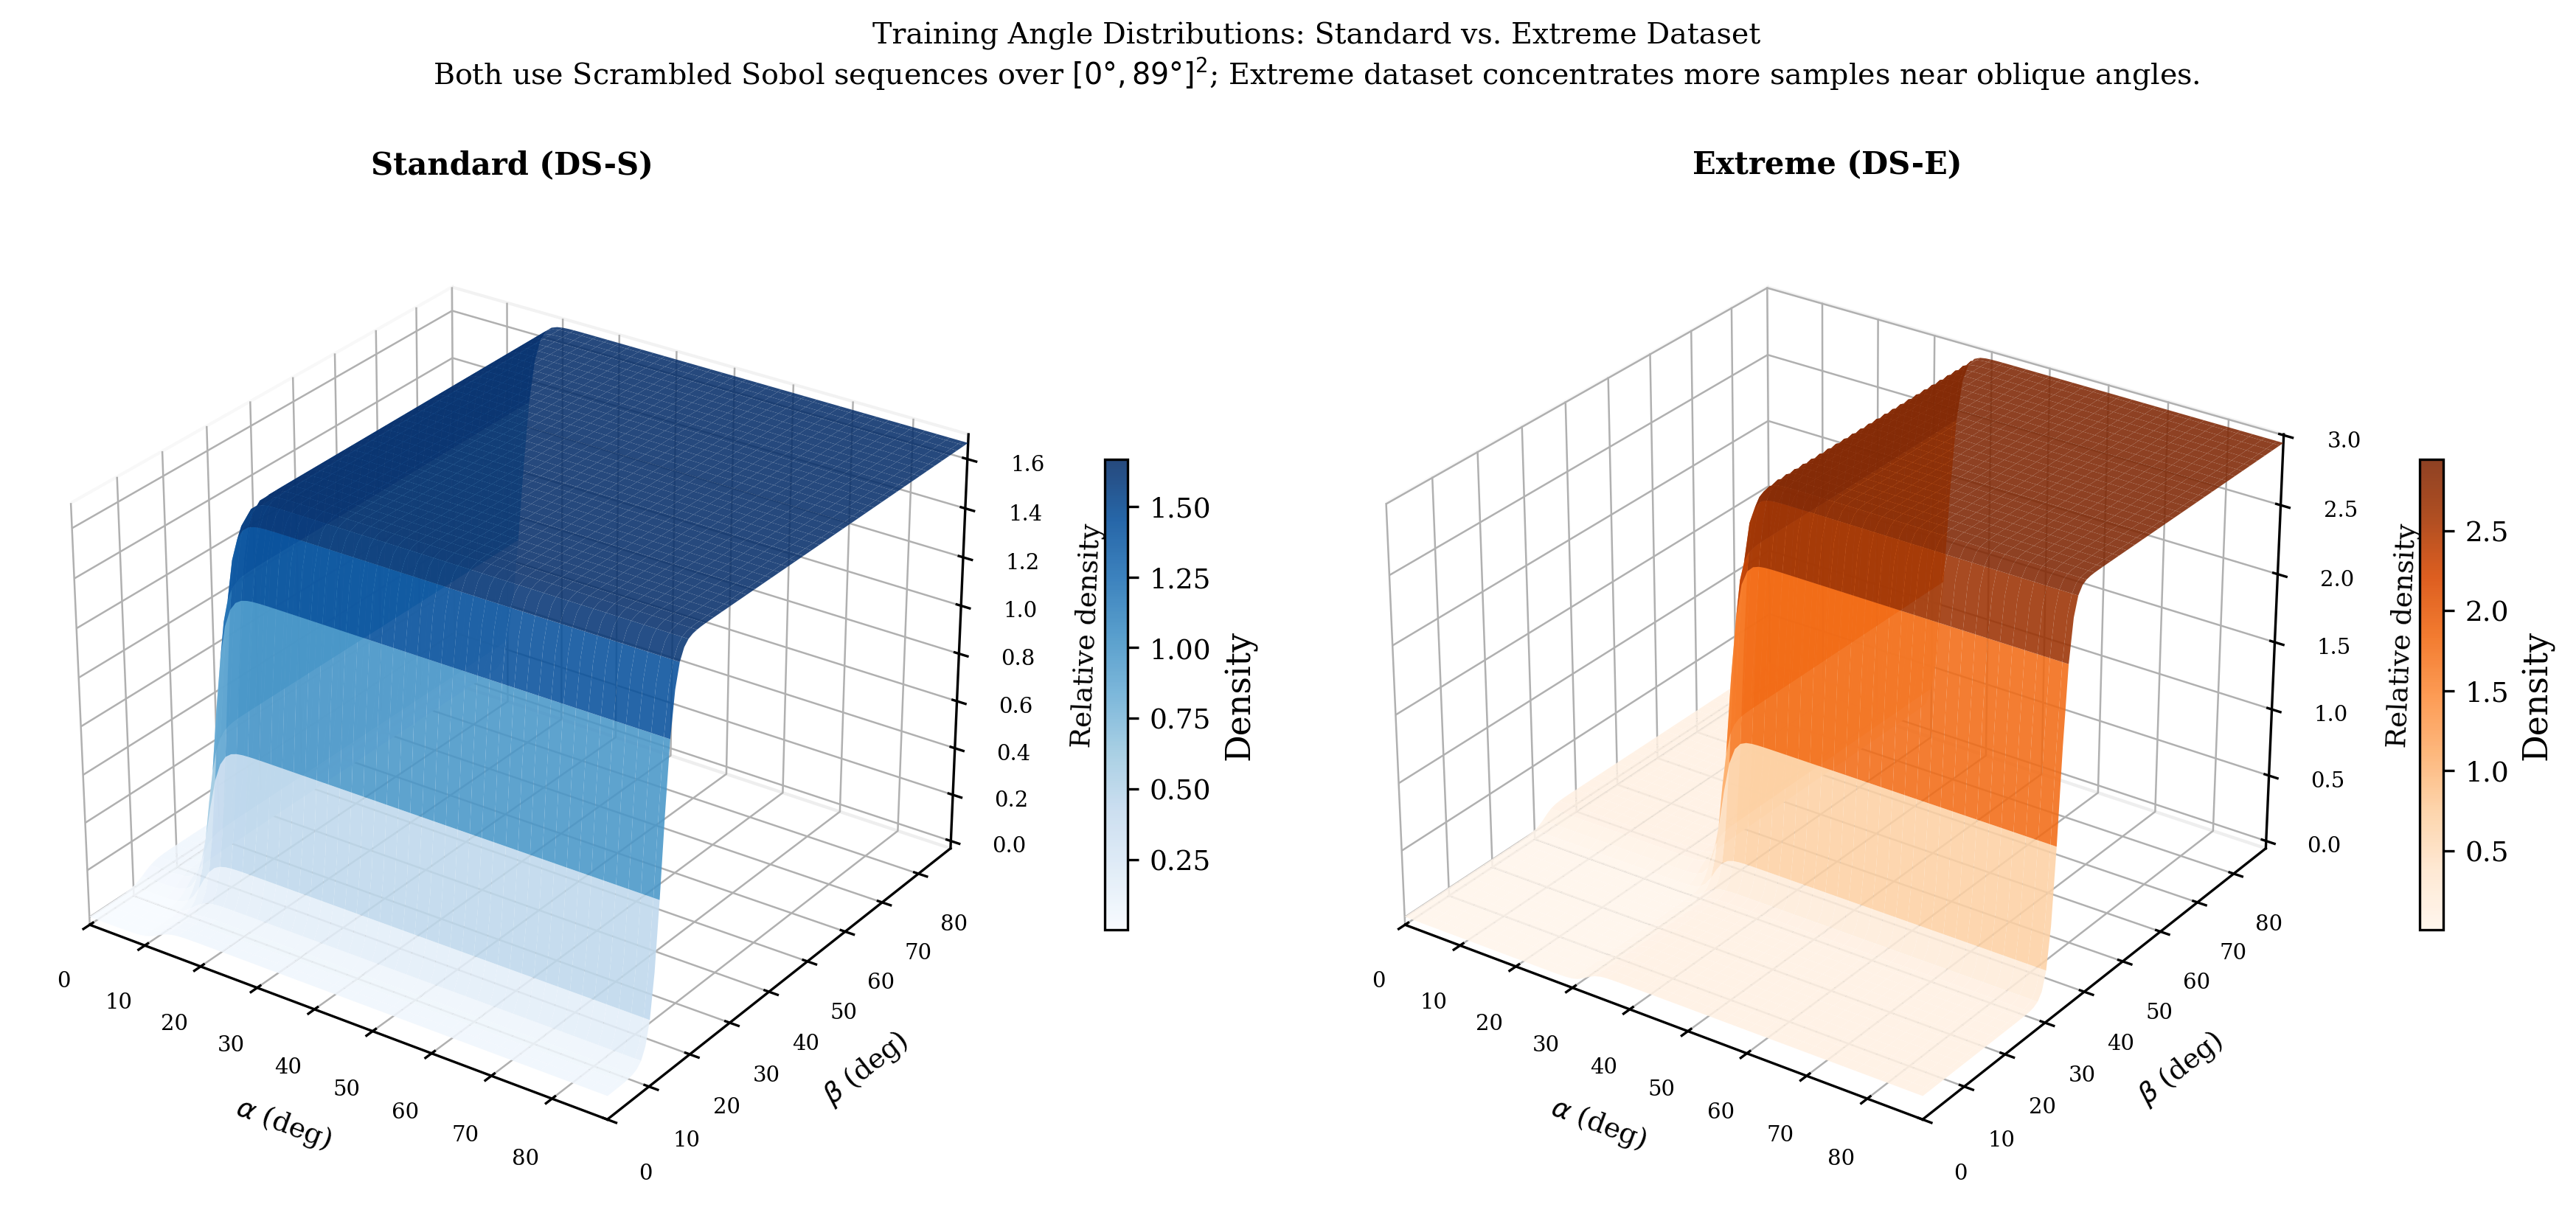
Angle pairs $(\alpha, \beta)$ are drawn from a parametric probability density function (PDF) over $[-90^\circ, 90^\circ]^2$ using Scrambled Sobol sequences (Joe & Kuo, 2008). This provides near-uniform coverage of the angle space with far fewer samples than random sampling. We define two PDF variants: a Standard variant (DS-S) with moderate emphasis on extreme angles, and an Extreme variant (DS-E) with a heavier tail that concentrates more samples near oblique angles. Two datasets are constructed (Table 1); Fig. 2 visualises their angle-density surfaces. All datasets use an 80/10/10 train/validation/test split.
| Dataset | Total pairs | Angle PDF variant | Train | Validation | Test |
|---|---|---|---|---|---|
| Standard (DS-S) | 10,240 | Moderate emphasis on extreme angles | 8,192 | 1,024 | 1,024 |
| Extreme (DS-E) | 10,240 | Strong emphasis on extreme angles | 8,192 | 1,024 | 1,024 |
Five architectures spanning discriminative and generative paradigms are implemented and compared (Table 2). All models take the $256 \times 64$ distorted image as input and produce a same-resolution restored image.
The U-Net baseline uses a standard encoder-decoder with skip connections and an L1 + SSIM loss. The U-Net Conditional extends this with FiLM (Feature-wise Linear Modulation) layers that inject the distortion angles $(\alpha, \beta)$ into each residual block, providing explicit geometric context. Restormer (Zamir et al., 2022) replaces convolutional blocks with multi-Dconv head transposed attention (MDTA) and gated feed-forward networks, enabling long-range spatial modelling relevant to correcting directional foreshortening.
GAN-Pix2Pix (Isola et al., 2017) adds a patch discriminator to the U-Net generator, using a combined adversarial and L1 loss. Diffusion-SR3 adapts the SR3 super-resolution diffusion framework (Ho et al., 2020) by conditioning the denoising network on the distorted plate. We use velocity prediction rather than noise prediction to stabilise training in the low-SNR uniform-colour regions of the plate:
where $\bar\alpha_t = \prod_{i=1}^t (1 - \beta_i)$ is the cumulative signal coefficient and $\epsilon \sim \mathcal{N}(0, I)$. At inference, deterministic DDIM sampling (Song et al., 2020) with 20 steps is used.
| Model | Type | Key feature | Loss | Params (M) | Optimiser | Base LR | Epochs |
|---|---|---|---|---|---|---|---|
| U-Net (baseline) | Discriminative | Skip connections, encoder-decoder | L1 + SSIM | $\approx 7.8$ | AdamW | $1\!\times\!10^{-4}$ | 120 |
| U-Net Conditional | Discriminative | FiLM conditioning on ($\alpha$, $\beta$) | L1 + SSIM | $\approx 7.9$ | AdamW | $1\!\times\!10^{-4}$ | 120 |
| Restormer | Discriminative | MDTA transformer, global context | L1 | $\approx 26.1$ | AdamW | $3\!\times\!10^{-4}$ | 150 |
| GAN-Pix2Pix | Generative | Patch discriminator, adversarial | Adversarial + L1 | $\approx 57.0$ | Adam | $2\!\times\!10^{-4}$ | 200 |
| Diffusion-SR3 | Generative | Velocity prediction, DDIM (20 steps) | Velocity MSE | $\approx 34.7$ | Adam + warm-up | $2\!\times\!10^{-4}$ | 600k steps |
All models are trained on a single NVIDIA RTX 3090 (24 GB) GPU. Each model is trained independently on both datasets (Standard and Extreme), yielding ten model-dataset pairs. The per-model configuration is summarised in Table 2. Batch size is $32$ for the three discriminative models, $16$ for GAN-Pix2Pix (generator plus discriminator), and $16$ for Diffusion-SR3. Discriminative models (U-Net, U-Net Conditional, Restormer) use the AdamW optimiser with weight decay $10^{-2}$ and a cosine-annealing learning-rate schedule decaying to $10^{-6}$ over the full training horizon. GAN-Pix2Pix uses Adam ($\beta_1 = 0.5$, $\beta_2 = 0.999$) with a fixed learning rate and alternates generator and discriminator updates every step. Diffusion-SR3 uses Adam with a 5000-step linear warm-up followed by constant learning rate, and is trained for a fixed step budget rather than an epoch count because of its multi-step denoising objective; inference uses deterministic DDIM sampling with 20 steps. Model selection uses the validation-split PSNR and SSIM as surrogates for OCR: the checkpoint achieving the highest PSNR on the held-out validation set is retained for the final full-grid evaluation. Data augmentation is limited to the angle-sampling distribution itself (Section 4.1); no photometric augmentation is applied beyond the camera artefacts baked into the construction pipeline. Typical wall-clock training time per model-dataset pair is 3-5 h for U-Net variants, 35-45 h for Restormer, 4-6 h for GAN-Pix2Pix, and 12-18 h for Diffusion-SR3.
A single shared evaluation set covers all integer angle pairs in $[0, 89]^2$ (8,100 pairs). Sampling density is 2 images per pair where $\alpha \leq 60$ and $\beta \leq 60$ (easy region), and 10 images per pair in the complementary high-distortion region ($\alpha > 60$ or $\beta > 60$). Six metrics are recorded per pair: plate-level PSNR and SSIM, worst-digit PSNR and SSIM, digit-level OCR accuracy, and plate-level OCR accuracy. The latter is the primary metric.
PSNR is computed as:
OCR is performed by Tesseract v4 (LSTM mode, digit-only filter). Each restored image is converted to grayscale, contrast-normalised, upscaled 2x, and binarised. A multi-strategy fallback (Otsu, adaptive threshold, colour inversion) is applied per digit if the primary recognition fails. The final recognised string is compared to the ground truth to compute digit-level and plate-level accuracy.
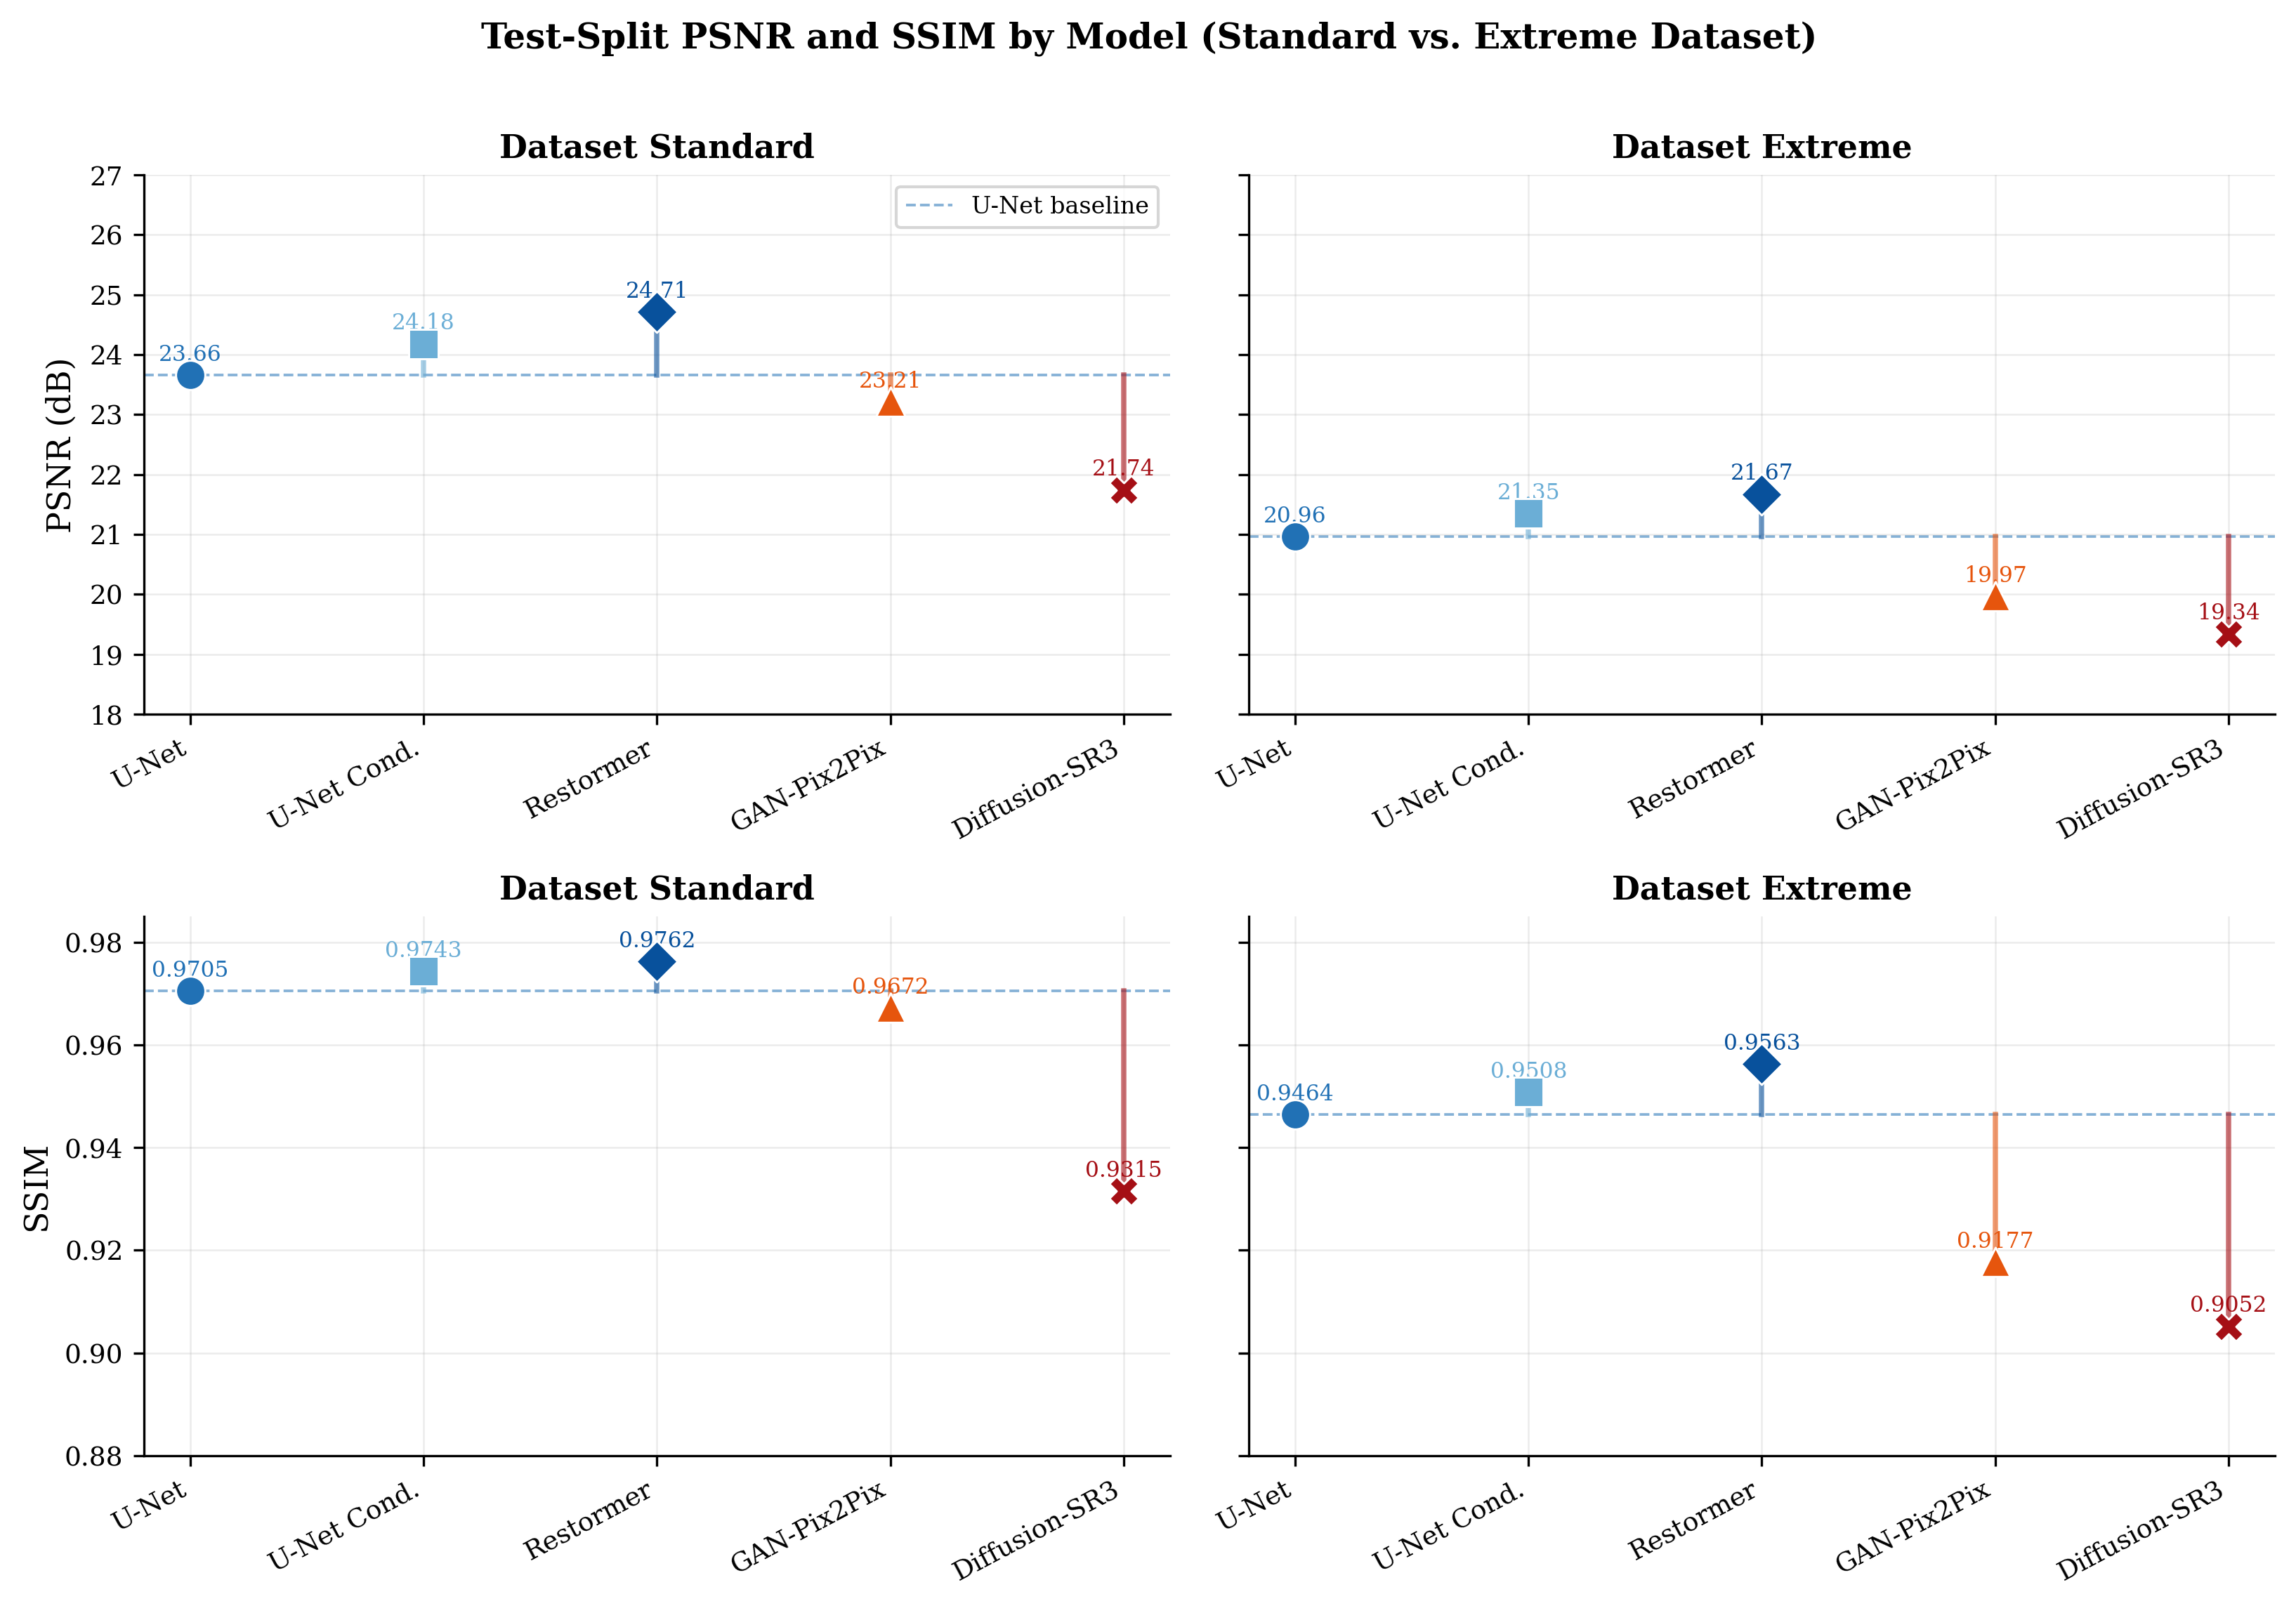
Table 3 reports PSNR, SSIM, normalised training time, and inference latency for each model-dataset pair. Restormer achieves the highest PSNR and SSIM on both datasets. Diffusion-SR3 consistently underperforms, particularly on SSIM, where it lags the U-Net baseline by $3.9$–$4.1$ percentage points.
| Model | Standard (DS-S) | Extreme (DS-E) | Train time (norm.) |
Latency (ms) |
||
|---|---|---|---|---|---|---|
| PSNR | SSIM | PSNR | SSIM | |||
| U-Net (baseline) | 23.66 | 0.9705 | 20.96 | 0.9464 | 1.00 | 11.75 |
| U-Net Conditional | 24.18 | 0.9743 | 21.35 | 0.9508 | 1.19 | 7.50 |
| Restormer | 24.71 | 0.9762 | 21.67 | 0.9563 | 14.87 | 14.01 |
| GAN-Pix2Pix | 23.21 | 0.9672 | 19.97 | 0.9177 | 1.23 | 7.34 |
| Diffusion-SR3 | 21.74 | 0.9315 | 19.34 | 0.9052 | 4.69 | 21.81 |
On the Standard dataset, Restormer outperforms the U-Net baseline by 4.5% PSNR and 0.6% SSIM. U-Net Conditional improves by 2.2% PSNR at a training cost only 1.19x that of U-Net. GAN-Pix2Pix underperforms by 2.0% PSNR, and Diffusion-SR3 underperforms by 8.0% PSNR and 4.0% SSIM. On the Extreme dataset the ranking is preserved, though absolute PSNR drops by $\sim$3–4 dB for all models, reflecting the harder angle distribution (Fig. 4).
Efficiency results confirm that U-Net Conditional offers the best accuracy-latency tradeoff at 7.50 ms inference. Restormer requires 14.87x the training compute of U-Net and has 14 ms latency. Diffusion-SR3 is the most expensive to deploy at 21.81 ms due to its 20-step DDIM sampling loop.
Evaluating plate-level OCR accuracy over the full $[0^\circ, 89^\circ]^2$ angle grid reveals several spatial patterns that are consistent across all five models and both datasets. Recognition is near-perfect (OCR $\approx 1.0$) when both $\alpha$ and $\beta$ are below $70^\circ$; this region covers the majority of the grid and is the basis for the high boundary-AUC values reported in Table 4. Recovery fails almost entirely once both angles exceed $80^\circ$, producing the approximately $6.6\%$ unrecoverable corner summarised in Section 5.3.
Critically, the boundary is not symmetric. Along the extreme-$\beta$ edge, accuracy remains high for $\alpha$ up to $\approx 60^\circ$ before declining. Along the extreme-$\alpha$ edge, accuracy drops sooner, even at low $\beta$. This $\alpha$-versus-$\beta$ asymmetry is consistent across both datasets and all five models, indicating that it is a property of the geometric distortion rather than any particular architecture. A plate viewed from the side (high $\alpha$) loses digit separability faster than a plate viewed from above (high $\beta$) because lateral foreshortening compresses the horizontal extent where digit strokes reside, while vertical foreshortening still leaves digit contrast largely intact. Fig. 8 (qualitative comparison) illustrates this asymmetry: at $(\alpha=30^\circ,\beta=88^\circ)$ most models still recover the plate, whereas $(\alpha=85^\circ,\beta=65^\circ)$ already causes the first digit to fail for every model.
Taking the pointwise maximum over all models and datasets yields the maximal recoverability boundary, which encloses a boundary-AUC of 0.934. Even pooling across all trained models and both training conditions, at most 93.4% of the $[0^\circ, 89^\circ]^2$ angle grid can be recovered at $\geq 90\%$ plate OCR accuracy. The remaining 6.6% (the upper-right corner, where both $\alpha$ and $\beta$ exceed $\sim 80^\circ$) is physically unrecoverable: the signal energy in the severely foreshortened plate image is too low for any current restoration method to extract a recognisable digit sequence. Across all ten model-dataset pairs the per-model boundaries cluster tightly (see Table 4), confirming that the recoverable region is determined by the physics of foreshortening rather than by architecture or training distribution. The $\alpha$-axis contracts faster than the $\beta$-axis, confirming the lateral rotation asymmetry.
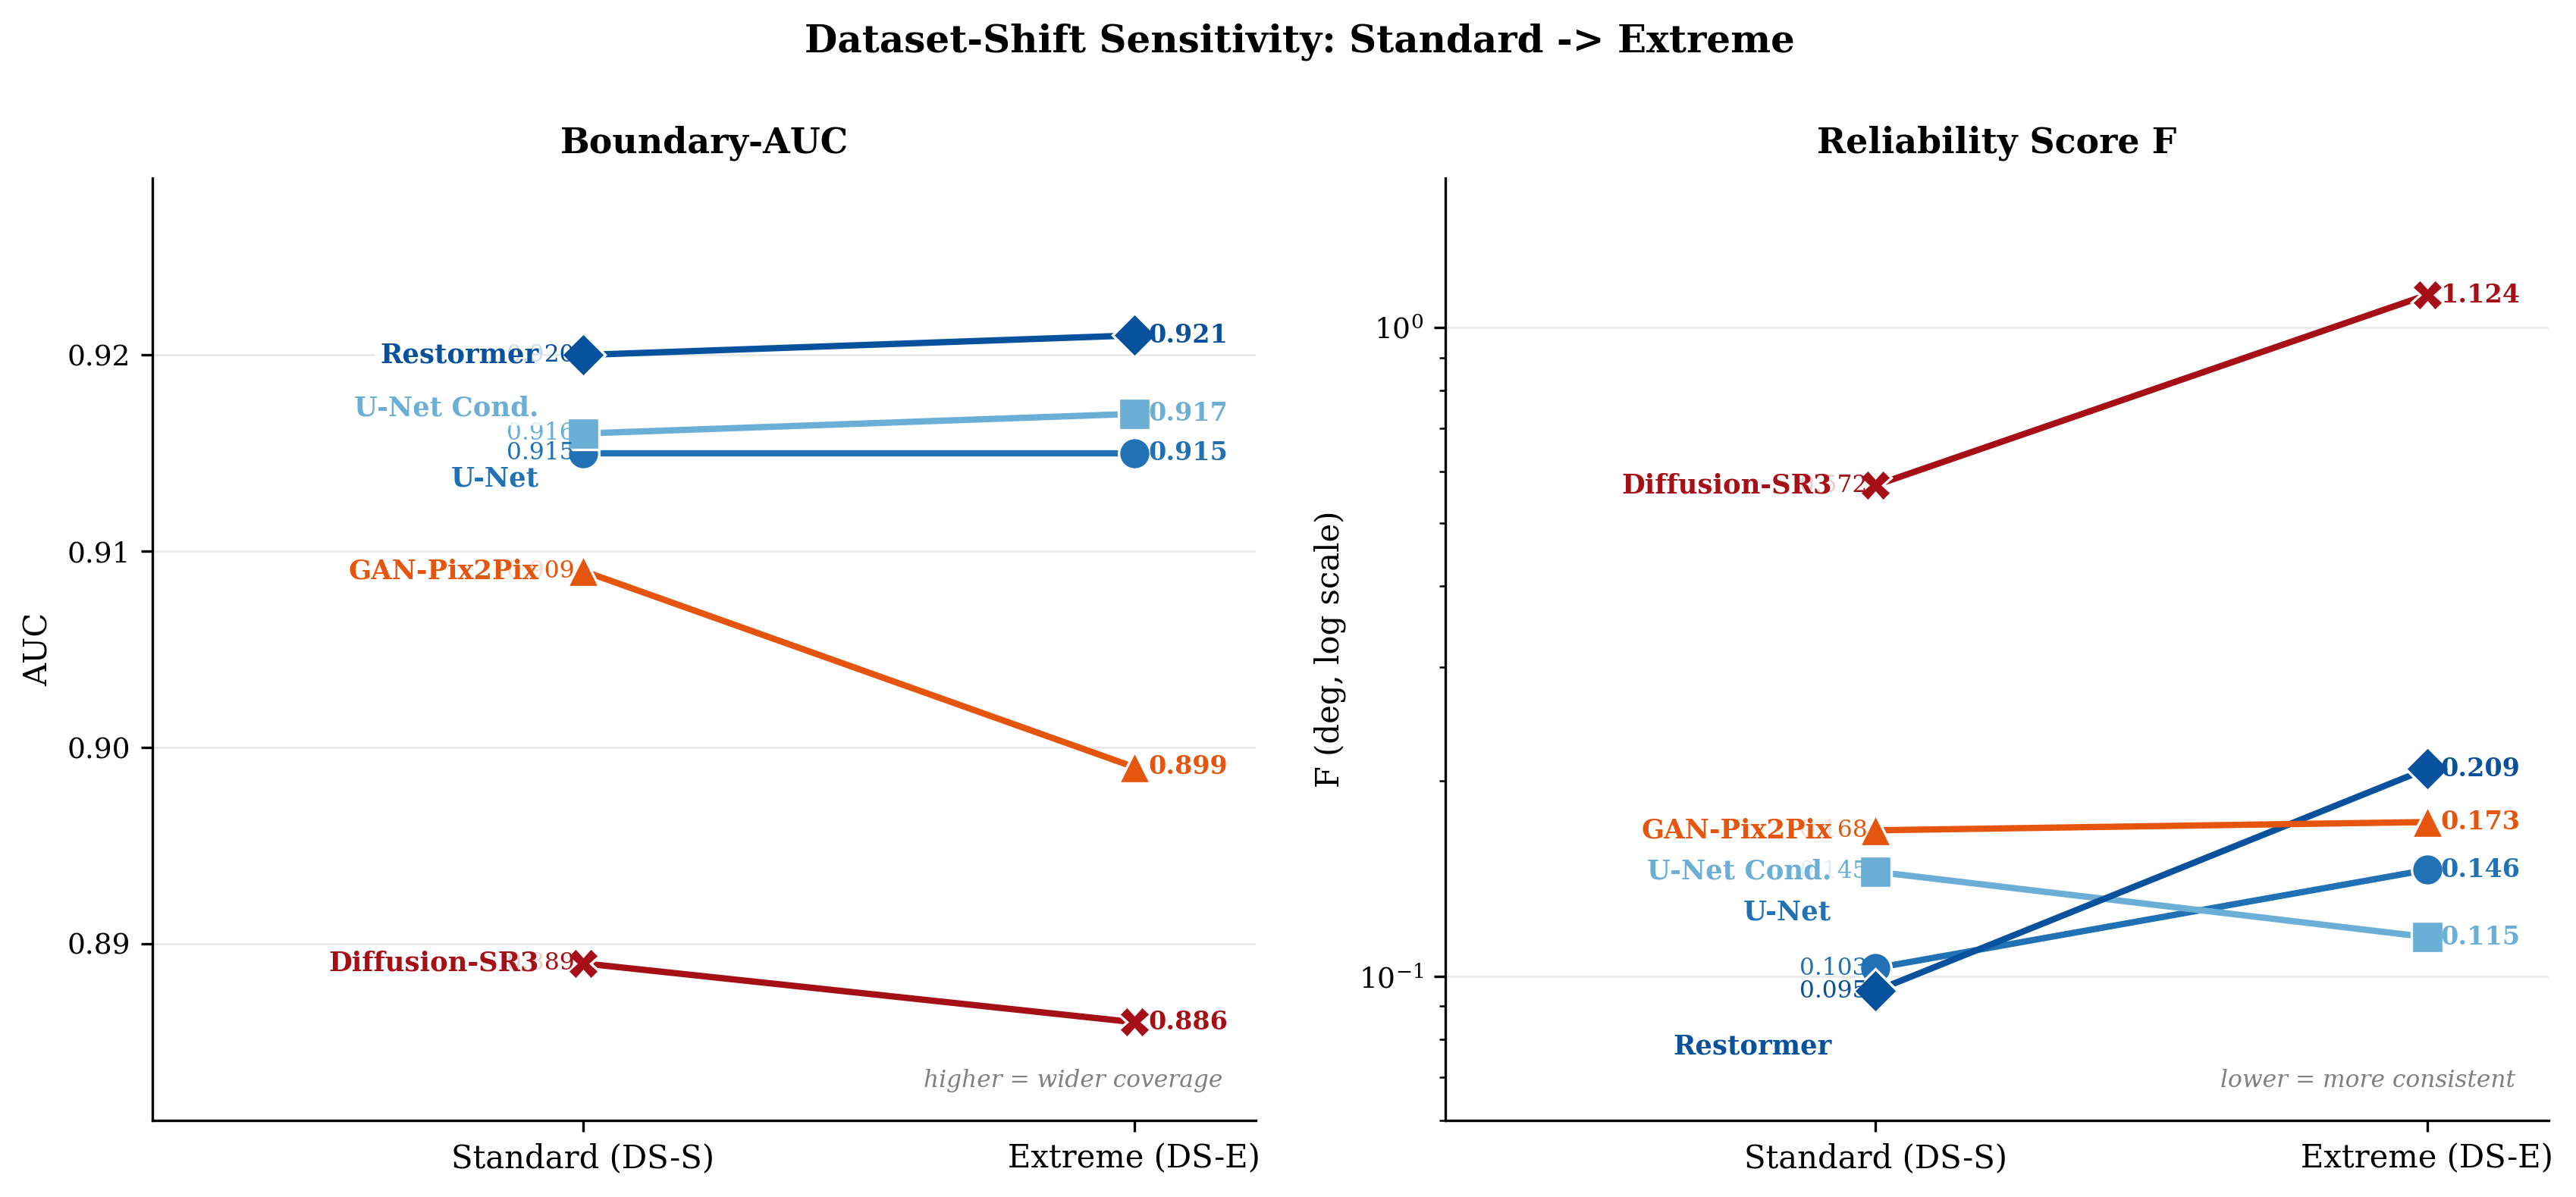
Table 4 summarises the boundary-AUC and reliability score $F$ for all model-dataset pairs (Fig. 5 visualises the dataset-shift sensitivity). Discriminative models cluster in the AUC range $[0.915, 0.921]$ with $F \in [0.095, 0.209]$, indicating both wide coverage and consistent interior performance. Generative models fall 1–3% lower in AUC: GAN-Pix2Pix achieves $F \approx 0.17$, while Diffusion-SR3 shows highly variable reliability, from $F = 0.57$ on Standard to $F = 1.12$ on Extreme. This instability reflects the tendency of diffusion models to hallucinate plausible but incorrect digit sequences when the conditional input carries insufficient signal.
Restormer achieves the best AUC on both datasets (0.920 and 0.921) and the lowest $F$ on Standard (0.095). On Extreme, however, its $F$ rises to 0.209 and U-Net Conditional takes the lowest $F$ (0.115); Restormer's coverage is therefore robust to training-distribution shift, but its interior consistency degrades. Comparing Standard and Extreme datasets, AUC values are nearly identical ($\Delta < 0.002$), indicating that training distribution shift does not substantially alter the recoverable boundary itself, only its interior reliability.
| Model | Standard (DS-S) | Extreme (DS-E) | ||
|---|---|---|---|---|
| AUC | F (deg) | AUC | F (deg) | |
| U-Net (baseline) | 0.915 | 0.103 | 0.915 | 0.146 |
| U-Net Conditional | 0.916 | 0.145 | 0.917 | 0.115 |
| Restormer | 0.920 | 0.095 | 0.921 | 0.209 |
| GAN-Pix2Pix | 0.909 | 0.168 | 0.899 | 0.173 |
| Diffusion-SR3 | 0.889 | 0.572 | 0.886 | 1.124 |
For system developers, a key practical question is whether PSNR or SSIM can serve as a reliable surrogate for OCR accuracy during model training and validation, avoiding the computational cost of running OCR on every epoch checkpoint.
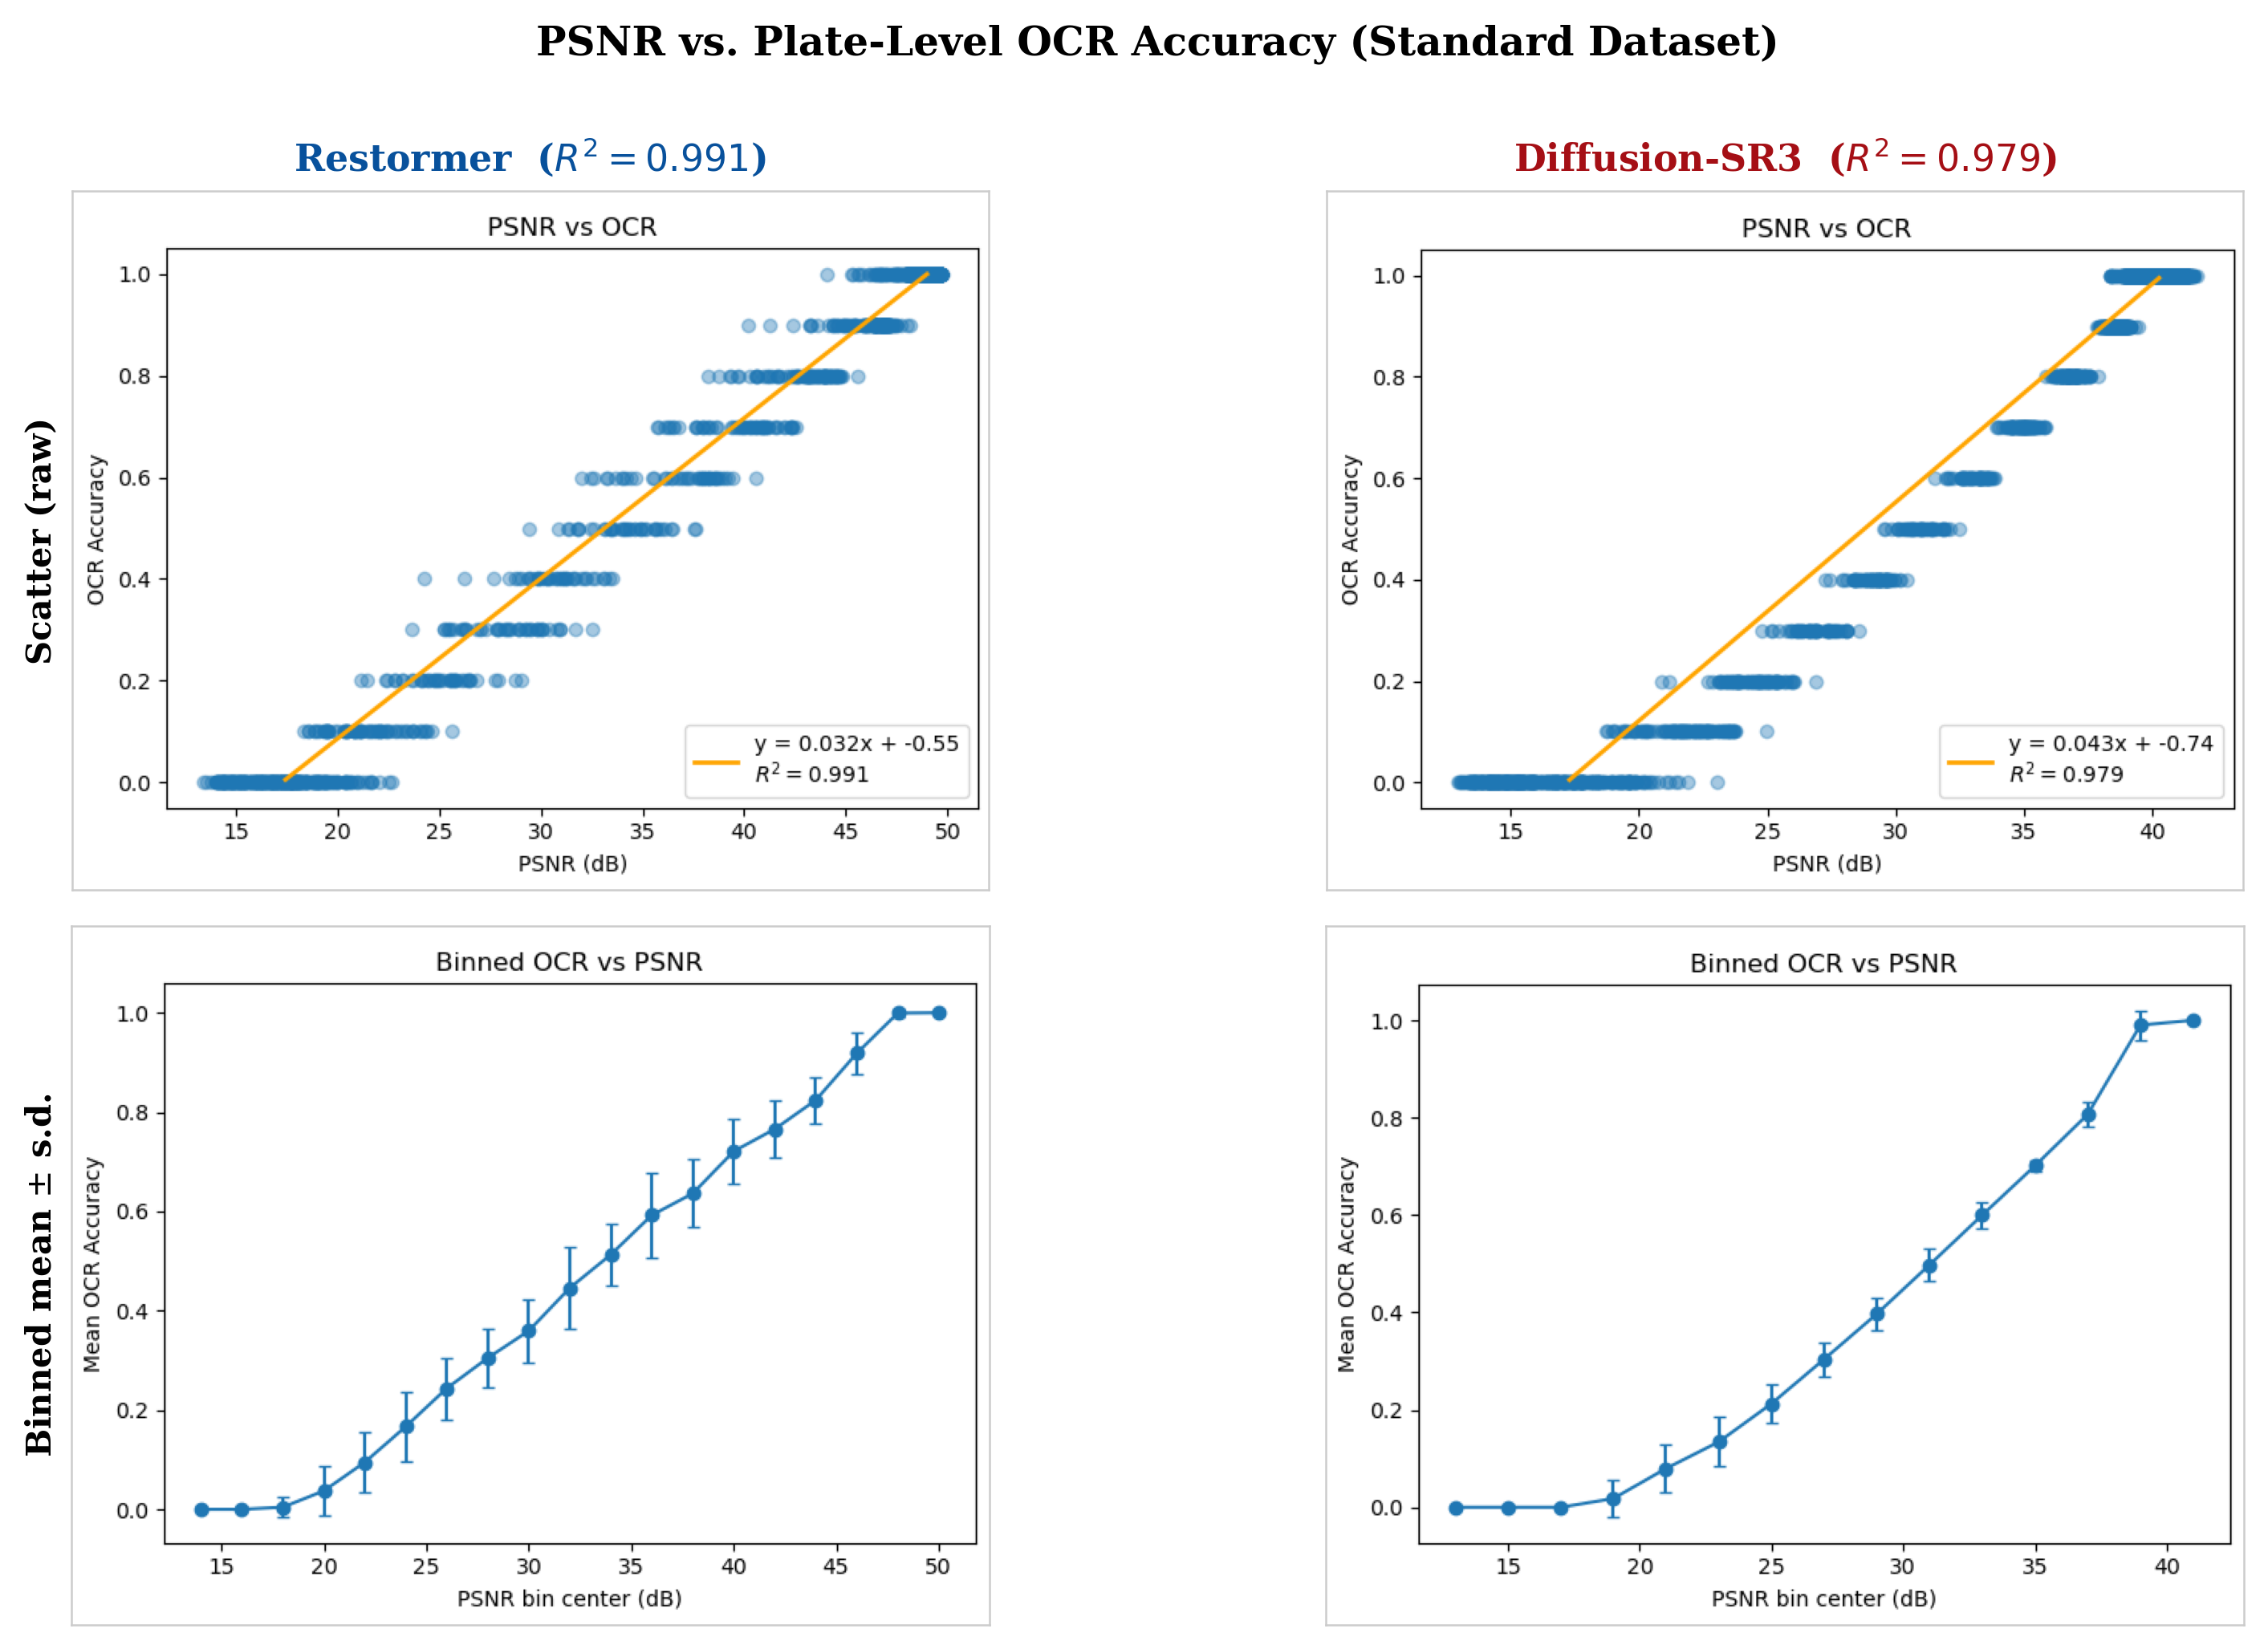
Fig. 6 shows the PSNR-OCR scatter for Restormer and Diffusion-SR3 on the Standard dataset, with each point representing one angle pair in the evaluation grid. The linear relationship is tight for both models:
Each additional 1 dB of PSNR yields approximately 3% OCR gain for Restormer and 4% for Diffusion-SR3. The error bars (one-standard-deviation bands over binned PSNR values) remain short across the full range, confirming that plates sharing similar PSNR values deliver nearly identical OCR outcomes. PSNR is thus a reliable training proxy; optimising it implicitly optimises OCR.
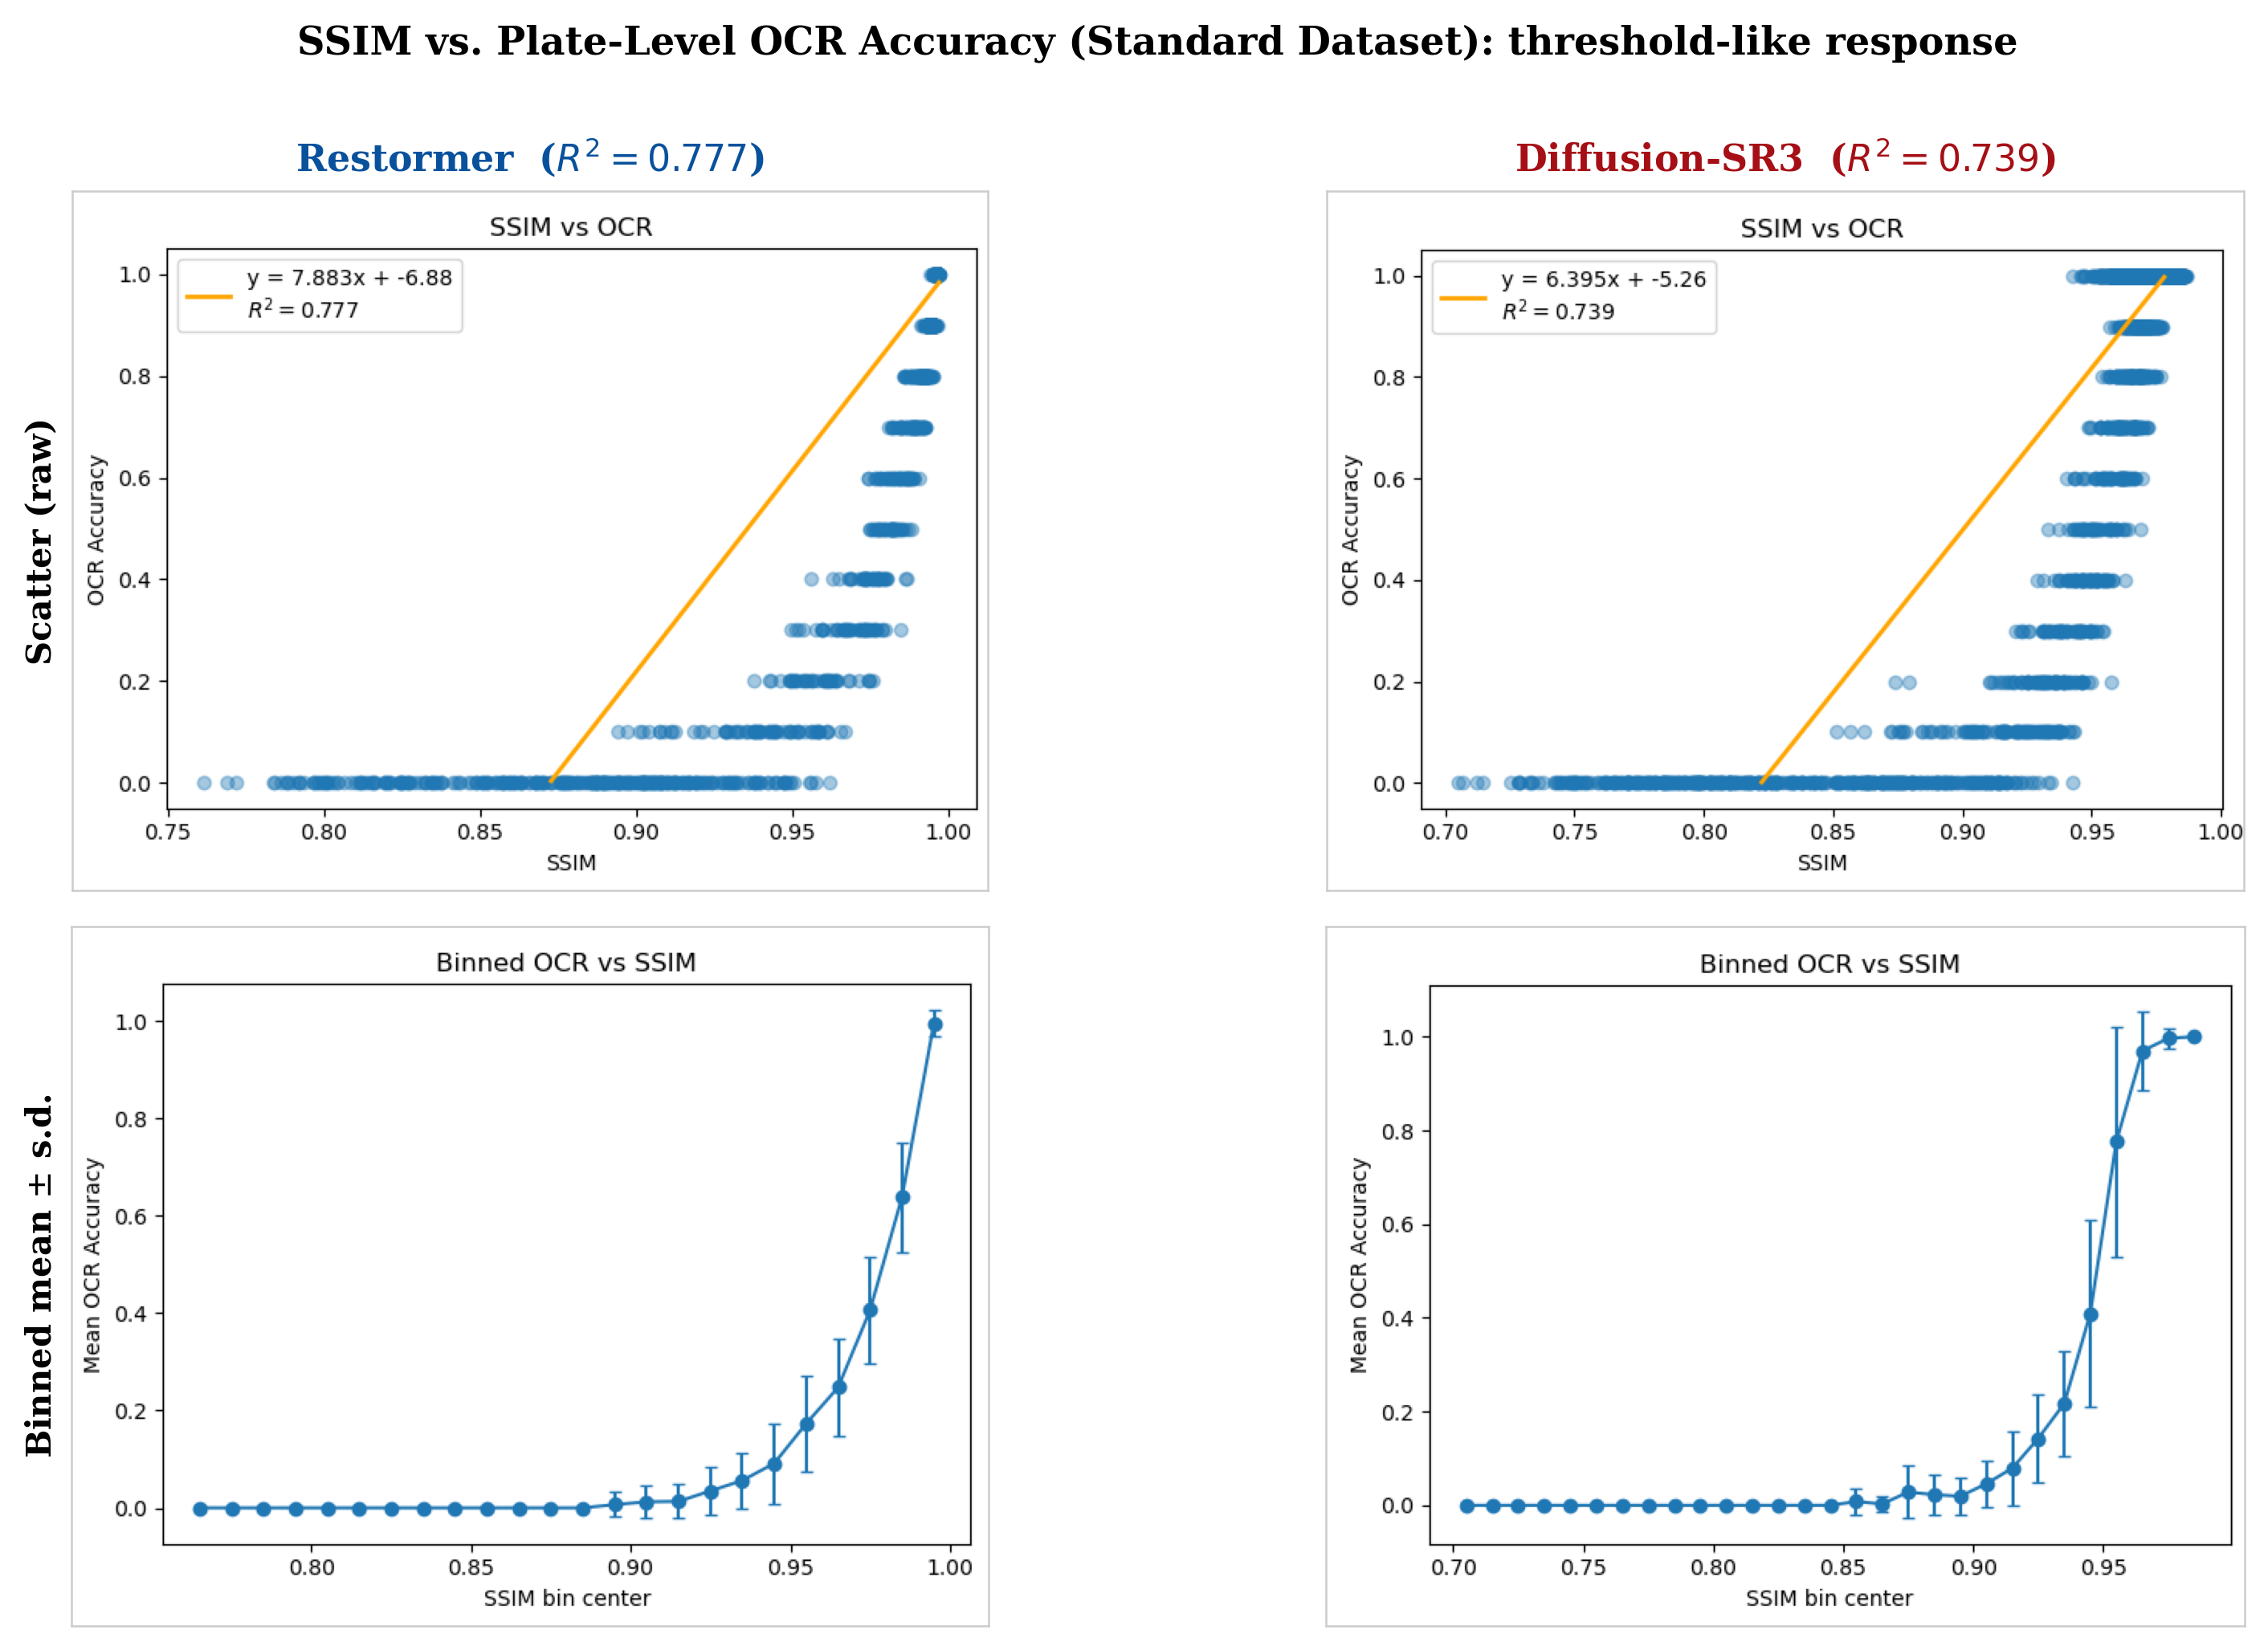
By contrast, the SSIM-OCR relationship is threshold-like (Fig. 7): OCR remains near zero until SSIM reaches approximately 0.87–0.88, then rises sharply. The linear fits:
explain only 74–78% of OCR variance, and the error bars in the transition zone are wide: plates at the same SSIM level can have near-zero or near-perfect OCR depending on which specific digits are distorted. SSIM should not be used as the primary validation metric for LPR restoration.
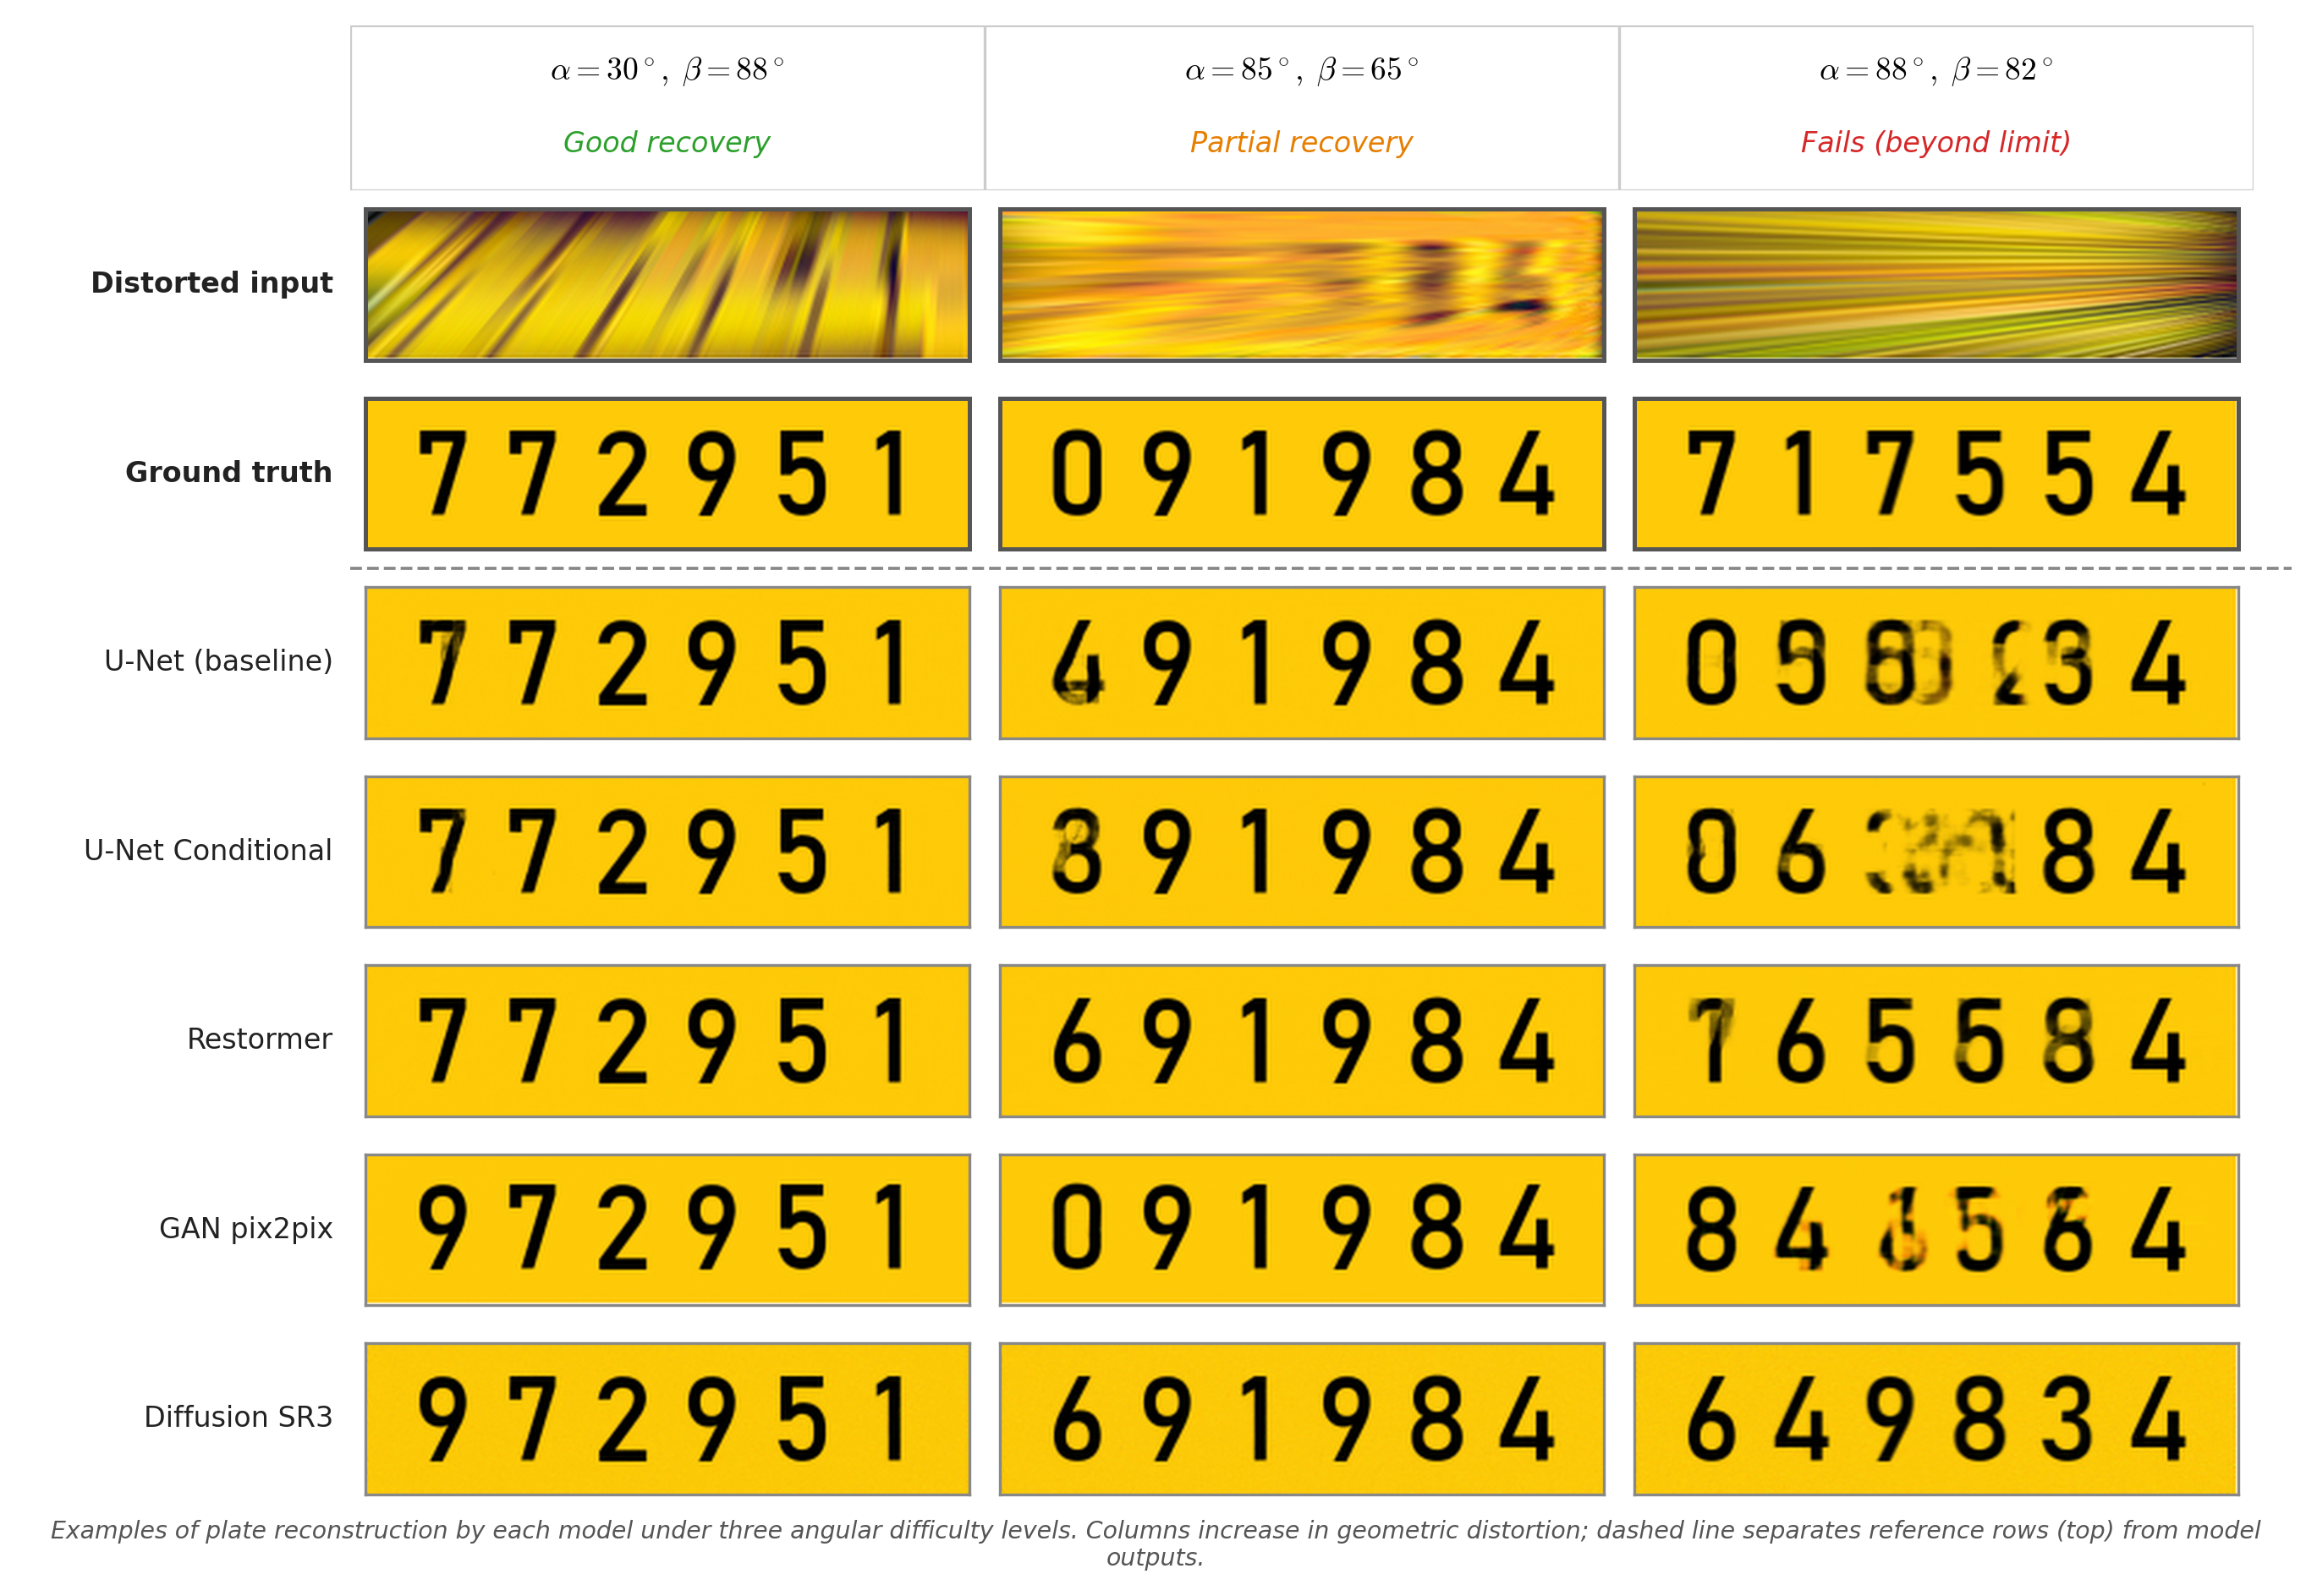
Three empirical patterns follow from the structure of the problem rather than from implementation details, and a fourth concerns how the training-angle distribution affects interior consistency rather than coverage. The $\alpha/\beta$ asymmetry reflects the information geometry of the plate itself: a license plate is a horizontal strip in which digit identity is encoded in the horizontal separation of character strokes rather than in vertical extent. An elevational rotation $\beta$ compresses vertical extent but leaves the horizontal digit sequence intact, whereas a lateral rotation $\alpha$ compresses the axis along which the digits are encoded, collapsing adjacent characters into each other long before the plate becomes geometrically unrecognisable. This asymmetry is visible in every model and is therefore a property of the input signal rather than of the networks.
The advantage of discriminative models reflects an alignment between training objective and task. U-Net, U-Net Conditional, and Restormer are trained end-to-end with paired (distorted, clean) samples and an L1 + SSIM objective, which is a direct regression of the distortion-to-character map that the networks must invert at inference time. GAN adversarial losses and diffusion denoising objectives instead prioritise perceptual plausibility, a criterion that competes with character fidelity: a plausible plate need not be the correct plate. Restormer and the U-Net variants therefore cluster near the top of Table 4 on both AUC and $F$. Diffusion-SR3's instability at extreme angles follows from the same tradeoff: when the conditional input carries low signal-to-noise the denoising network is free to sample any digit string consistent with the remaining evidence, producing plausible but incorrect plates. The reliability score $F$ captures this directly, rising to $1.124$ on DS-E, an order of magnitude worse than any discriminative model.
The training distribution shapes interior consistency rather than coverage. Boundary-AUC is nearly identical across the Standard and Extreme datasets ($\Delta < 0.002$ for the discriminative models), indicating that the extent of the recoverable region is bounded by the physics of foreshortening rather than by the training-angle PDF. The angle PDF does, however, shape $F$: the Extreme dataset destabilises Diffusion-SR3 ($F$ rises from $0.57$ to $1.12$) and produces small shifts in interior behaviour for the other models. This is the classical bias-variance tradeoff of data distribution design and implies that practitioners building real-data pipelines should prioritise angular diversity and corner coverage over raw sample count.
The recoverability-map framework introduced in Section 3 is deliberately task-agnostic, and the methodology demonstrated here on oblique-view LPR transfers to several other opportunistic-sensing problems of interest to the urban-systems community. Face recognition from pole-mounted or body-worn cameras under controlled pose and occlusion parameters fits the framework directly: the parameter space becomes (yaw, occlusion fraction) and the utility is a thresholded face-identification score. Scene-text reading from dashcam imagery under glare and motion-blur parameters is another natural instantiation. Gait recognition from non-frontal CCTV, where the parameter space is camera viewpoint and walking-direction offset, is a third. In each case the same two summary measures, boundary-AUC and the reliability score $F$, would yield a comparable quantitative deployment guideline. We leave these instantiations as future work and present LPR here as a concrete first demonstration that the framework produces actionable numbers.
The 93.4% maximal recoverability boundary provides a quantitative first-order planning guideline for urban infrastructure. Under the assumptions of the benchmark, if the worst-case viewing angle for a fixed sensor installation is bounded by $\alpha < 80^\circ$ and $\beta < 80^\circ$, then software-only restoration appears capable of recovering legible plates without hardware modification; this envelope covers the majority of practical ATM-camera, body-worn-device, and streetlight-camera geometries, whereas sensors placed with extreme lateral tilt and extreme elevation simultaneously fall outside it. Translating this guideline into a deployment criterion requires the real-data validation discussed in Section 7.
Among the evaluated architectures, discriminative models are the clear operational choice: they are easier to validate through explicit loss functions, more stable to train, and their PSNR improvements translate directly to OCR gains (Eqs. 10–11). The hallucination behaviour of Diffusion-SR3 under low signal is a serious liability in any identity-recognition setting, since the model produces a visually clean plate with plausible but incorrect digits, a confident false reading that a downstream confidence filter cannot distinguish from a correct one. Discriminative models, by contrast, produce blurred or ambiguous outputs under the same conditions, which such filters can reject. Among discriminative models, U-Net Conditional offers the best operational tradeoff: accuracy within 2% of Restormer, only 1.19x the training cost of the U-Net baseline, and the lowest inference latency (7.50 ms) of any model tested, which is compatible with real-time processing of continuous fixed-sensor streams at over 100 frames per second on a single GPU.
The $\alpha/\beta$ asymmetry gives a practical corollary for camera placement: lateral mounting angle (which determines $\alpha$) is a more critical variable than vertical elevation (which determines $\beta$). A camera mounted very high on a pole retains LPR capability across a wide range of vehicle distances because the plate remains partially visible; a camera angled steeply to the side loses digit separability earlier. Urban planners seeking to enable opportunistic LPR from pole-mounted sensors should prioritise constraining the azimuthal angle over the elevational angle in sensor placement guidelines.
Two additional deployment use-cases follow directly from the recoverability map:
The study has several bounded scope conditions that should be read alongside the headline results. The benchmark is fully synthetic: clean plates are rendered in a single standard vehicle-plate format at a fixed $256 \times 64$ resolution, distorted by a fixed homographic pipeline at constant focal length and plate-to-camera distance, and perturbed with Gaussian blur ($\sigma \in [0.5, 1.5]$), colour jitter, and JPEG compression (quality $\in [55, 85]$). Real captures introduce additional effects not modelled here, including scale variation with vehicle distance, motion blur, rolling-shutter skew, low-light noise, multi-font plate designs, dirt, and partial occlusion. Absolute recoverability thresholds reported in this paper, including the $93.4\%$ maximal coverage figure, therefore belong to the benchmark; the structure of the recoverability space (the location of the boundary, the $\alpha/\beta$ asymmetry, and the relative ordering of architectures) is the transferable contribution.
The OCR back-end is Tesseract v4 with standard preprocessing (grayscale, contrast normalisation, $2\times$ upscaling, binarisation, per-digit fallbacks). A stronger end-to-end plate-specific OCR (for example PaddleOCR or a CRNN variant) would likely shift the absolute boundary numbers, though the relative ranking of architectures is expected to remain stable.
This paper introduced recoverability maps, a task-agnostic framework for quantifying where in a parameterised degradation space an opportunistic-sensing task remains reliable. The framework builds on two summary measures adapted from classical operating-characteristic analysis: a boundary area-under-curve that captures coverage, and a reliability score $F$ that captures interior consistency. We demonstrated the framework on oblique-view license plate recognition as a concrete first instance.
Applied to LPR, the framework yields a sharp quantitative envelope. Approximately $93.4\%$ of the $[0^\circ, 89^\circ]^2$ angle grid is recoverable at $\geq 90\%$ plate OCR accuracy; beyond roughly $80^\circ$ in both axes simultaneously, none of the evaluated architectures extracts a reliable plate number. The most intellectually load-bearing finding, however, is structural: all five restoration architectures share the same $\alpha/\beta$ asymmetry, in which lateral rotation is consistently harder to correct than elevational rotation. This asymmetry is a property of the input signal, namely the horizontal information geometry of the plate, rather than of any particular network, and it carries directly into camera-placement guidance for urban infrastructure. Discriminative architectures (U-Net, U-Net Conditional, Restormer) consistently outperform generative alternatives (GAN-Pix2Pix, Diffusion-SR3) in coverage, consistency, and reliability; the latter's hallucinations under low signal are a material liability for any identity-recognition application. PSNR tracks OCR accuracy closely enough ($R^2 \geq 0.979$) to serve as a training-time surrogate, which materially simplifies the model-selection loop by making OCR-in-the-loop validation unnecessary.
Within the benchmark, most oblique viewing angles yield recoverable plates, a small double-extreme corner of the angle grid does not, and these findings, together with the framework itself, transfer to a broader class of opportunistic-sensing problems. The absolute numbers belong to the benchmark; the structural findings and the framework are the transferable contribution.
A natural future-work direction follows from the observation, already raised in the Introduction, that public benchmarks do not sample the extreme parameter regimes in which opportunistic sensing actually operates. Closing this gap, for LPR and for the candidate tasks listed in Section 6.2, requires either synthetic benchmarks of the kind presented here (extended to additional tasks and to richer acquisition models) or bespoke controlled-capture datasets that systematically sweep the parameter space. Within LPR specifically, complementary next steps are multi-seed statistics on $F$ to establish confidence intervals on the architecture ordering, and a sensitivity analysis with a stronger end-to-end plate OCR.
Conceptualization, A.A. and Y.A.; methodology, I.A., O.B.A. and A.A.; software, I.A. and O.B.A.; validation, I.A., O.B.A. and A.A.; formal analysis, I.A., O.B.A. and A.A.; investigation, I.A. and O.B.A.; data curation, I.A. and O.B.A.; writing, original draft preparation, I.A., O.B.A. and A.A.; writing, review and editing, Y.A. and A.A.; visualization, I.A. and O.B.A.; supervision, Y.A. and A.A.; project administration, A.A. All authors have read and agreed to the published version of the manuscript.
This research received no external funding.
Not applicable. This study did not involve humans or animals; all license plate imagery used in the benchmark is synthetically generated with randomly sampled digit strings.
Not applicable.
The companion repository for this paper is hosted at https://github.com/apartsin/OpportunisticSensing4LPR and contains the paper (HTML and MS Word), all figures used in the manuscript, the figure-generation scripts required to reproduce the plots, the five restoration-architecture implementations (U-Net, angle-conditioned U-Net, Restormer, Pix2Pix, SR3 diffusion), and notebooks covering the Scrambled Sobol angle sampling, the full-grid evaluation harness, and the Tesseract v4 OCR pipeline described in Section 4. The synthetic datasets analysed in this study are not redistributed as static files; they are fully and deterministically reproducible by re-running the sampling notebook with the Sobol seeds and distortion-pipeline parameters documented in Section 4.1 and Table 1, which yields bit-identical training, validation, and test splits. Pre-computed per-angle-pair evaluation results used to produce the figures and tables are available from the corresponding author on request. A DOI-minted Zenodo snapshot of the final repository release will accompany the peer-reviewed version of the paper.
The authors declare no conflict of interest.